Coding the Climate:
3D Data Visualization of
Sea Ice Extent for Polar Seas
3D Data Visualization of
Sea Ice Extent for Polar Seas
Mary Bates Neubauer, Jennifer Weiler, Daisy Nolz
The Neubauer, Weiler, and Nolz team combined a wide variety of skill sets to undertake an extensive project involving visual and tactile data visualization of an important indicator of global climate change: sea ice extent. The resulting collection of two and three dimensional tactile images stem from the team's ability to develop original coding, intensive information-bearing 3D modeling and rendering, 3D printing, robotic tool-path stone milling, and ceramic shell metal casting.
Sea Ice Data Collection
Sea ice forms, grows, and melts exclusively in the ocean, and is never formed on land. The determination of annual sea ice extent is an important indicator in determining the speed of global warming. It is a seasonally cyclical measure of the surface area of polar seas and oceans that are covered by ice. As air or water temperatures increase, sea ice extent decreases, resulting in the exposure of the dark ocean surface to solar radiation, resulting in amplification of warming. This project is based on a NOAA-based data set: MASIE sea ice extent. This data set, one of the most comprehensive we found, covers daily extent for all sixteen ice-forming seas in the Northern Hemisphere, including such bodies of water as the Canadian Archipelago, the Beaufort Sea, and the Gulf of St Lawrence. The numerical text file from which this project was developed consists of over 70,000 data points recording sea ice extent in square meters in the Northern Hemisphere from 2006 to 2018. Data from all sixteen seas were charted separately. While sea ice behaved differently in each instance, the overall result modeled progressive losses of ice cover.
Visualizing the Data
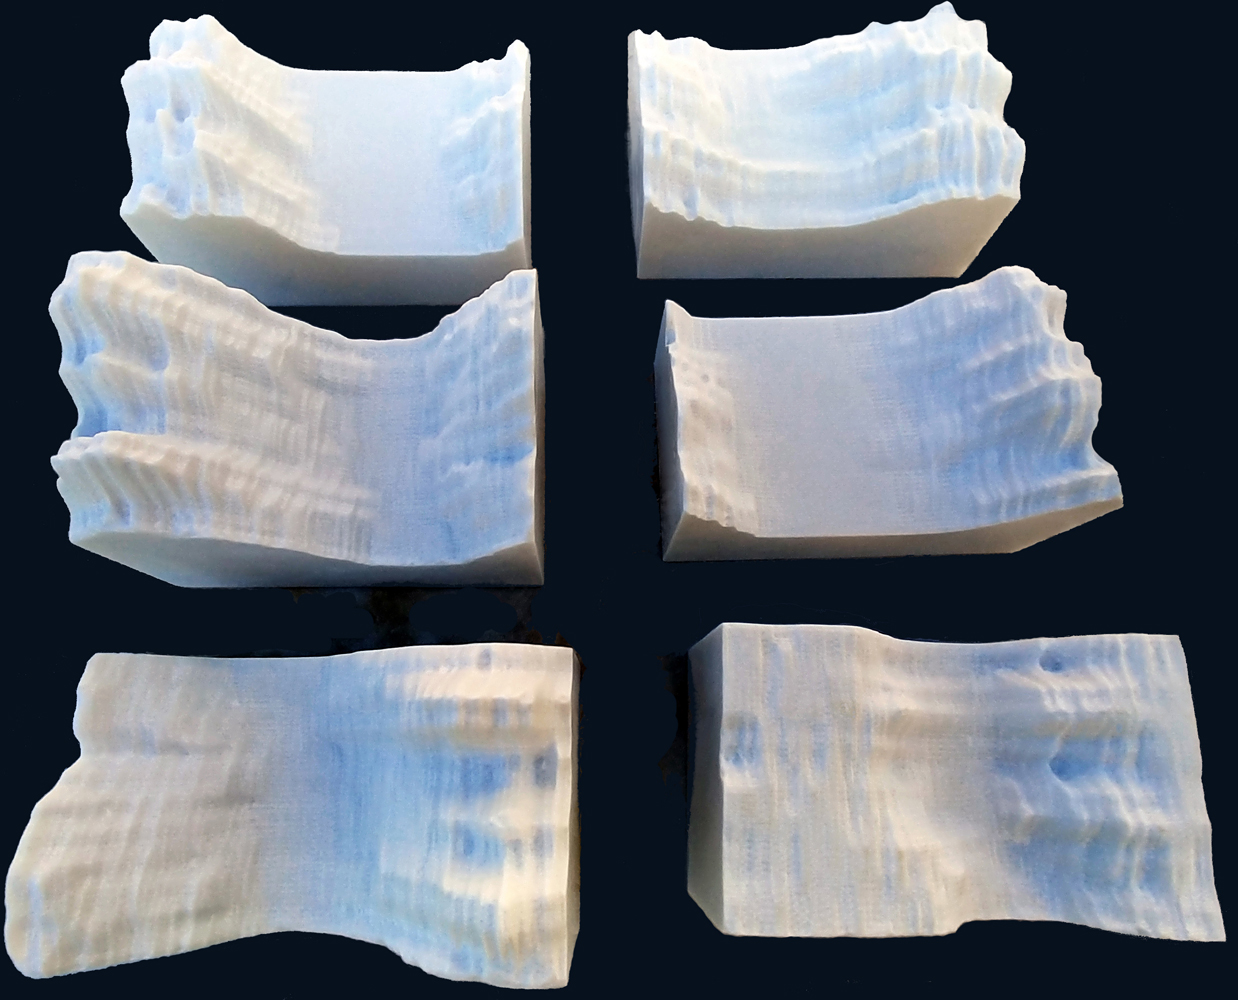
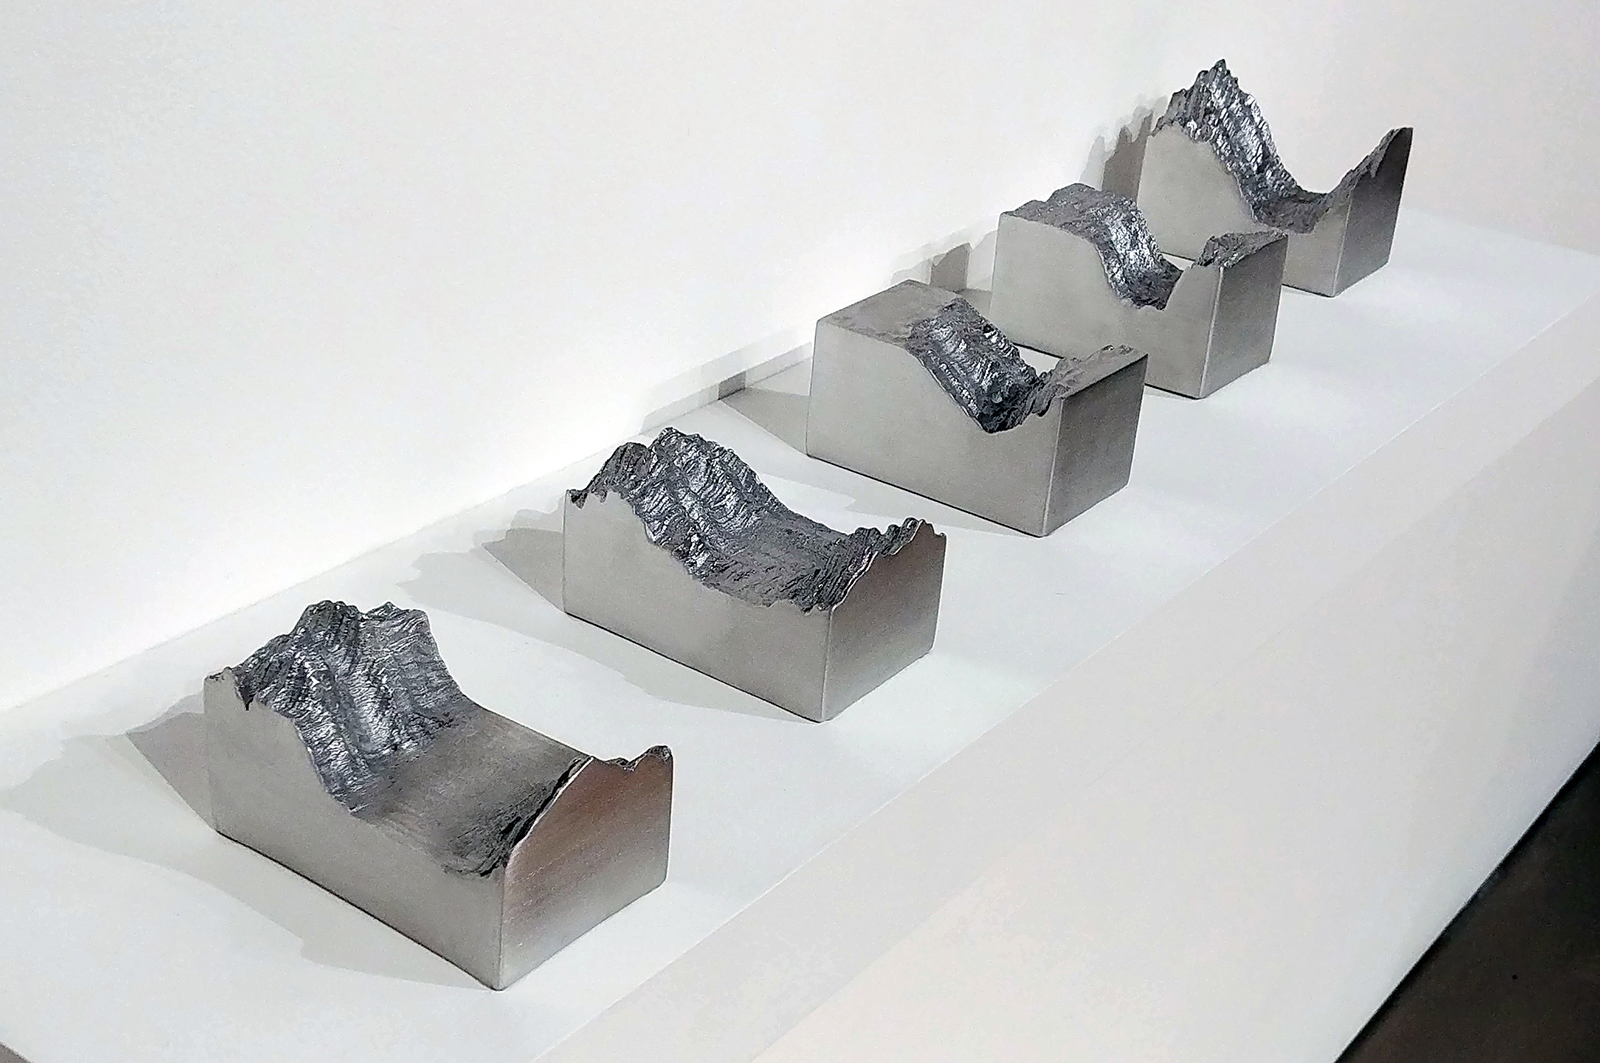
The team used custom coding to develop detailed dimensional models of each body of water. The resulting sculptural forms present a nuanced picture of our critical moment in geological time, a time of accelerating sea ice loss in the Arctic regions. These forms, realized as versatile .stl/.dxf files have taken on permanence when robotically milled in marble, 3D printed, molded and cast in various white-metal alloys and rendered as Digital Lambda prints. By translating an dense and seemingly arcane .txt data base into more accessible formats (climate models that feel more palpable than sterile line graphs or PowerPoint punch-lines) we seek to drive home the facts by making climate models that can be touched and felt. We have sought to create images that convey the reality and immediacy of our global climate situation through their tactility, materiality, and compelling sculptural presence. We have determined to capture a moment in geological time - a tipping point that records the increasingly alarming and precipitous loss of arctic sea ice extent over the last 18 years. The team anticipates that the resulting sculptures and images are robust, true to the underlying data, and clear enough to help the public understand what climate change looks like now at a visceral and tactile level.
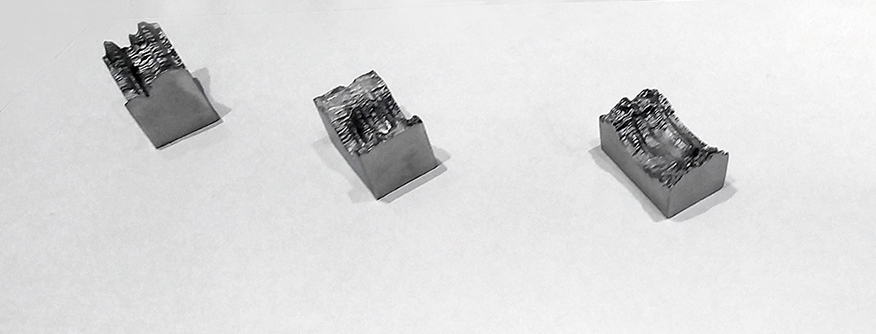
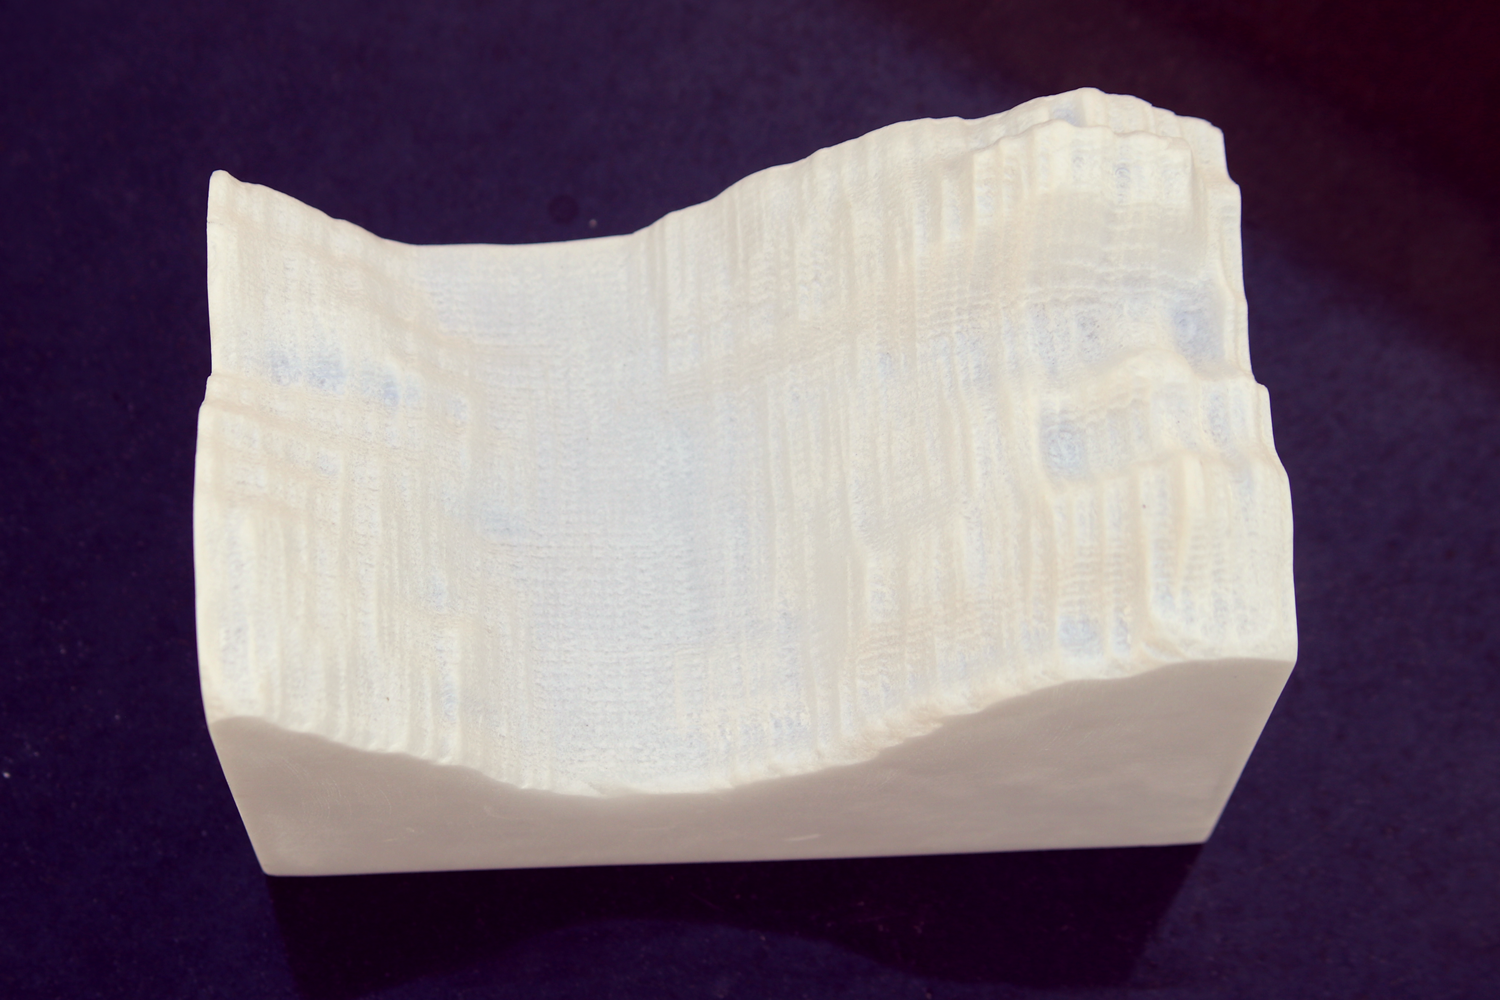
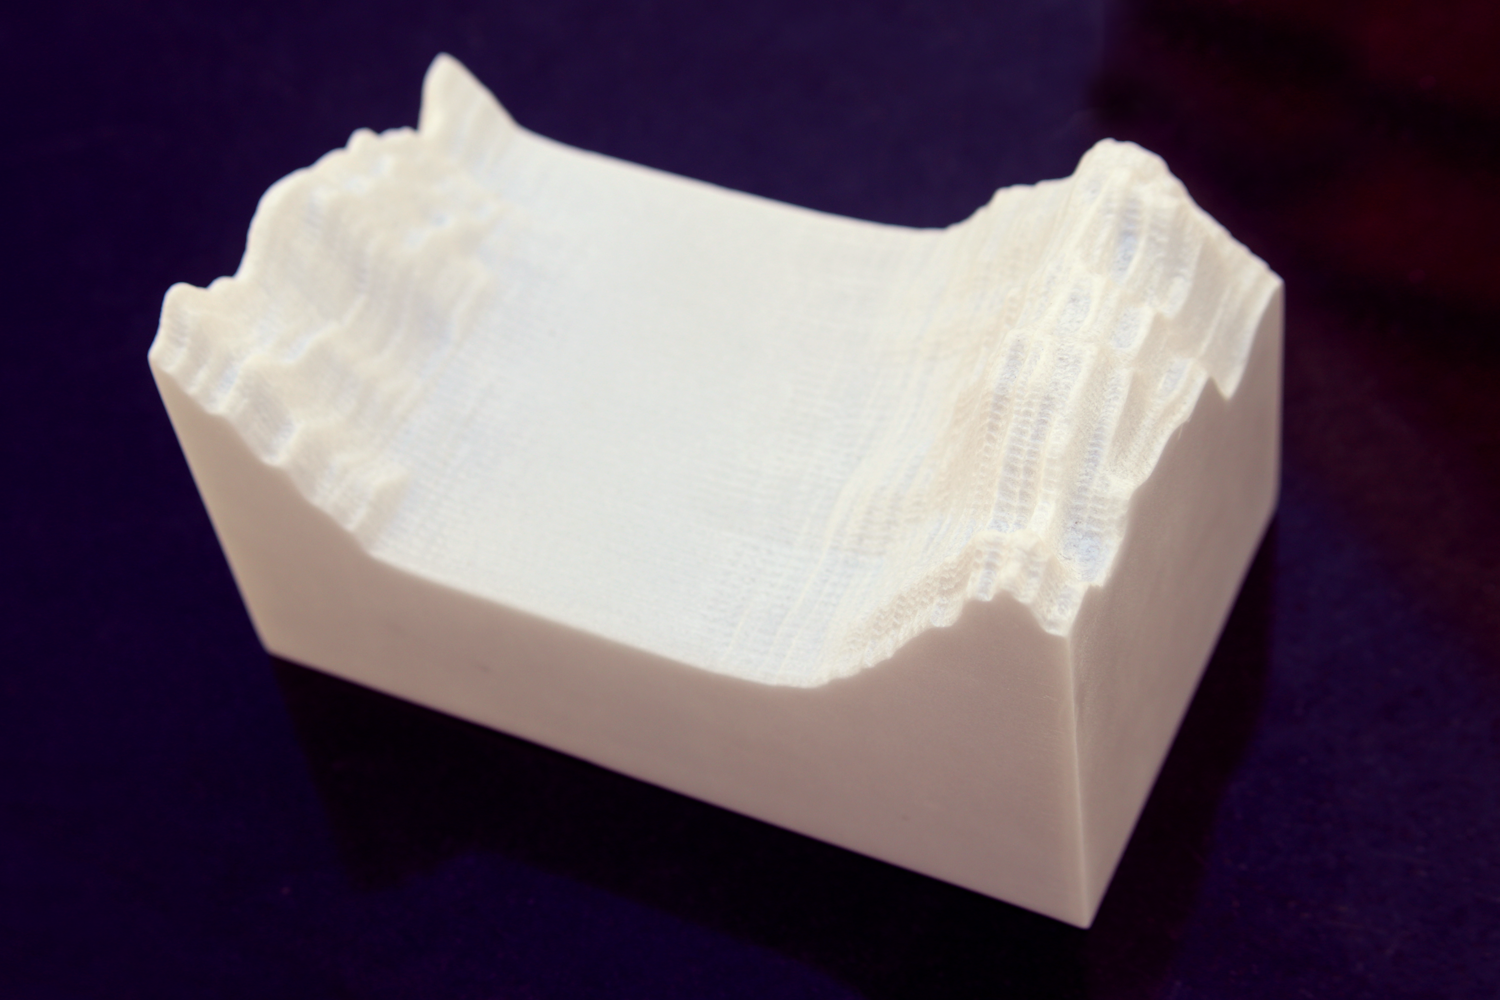
Cast metal sculptures created from ice data from bodies of water in the Polar Seas
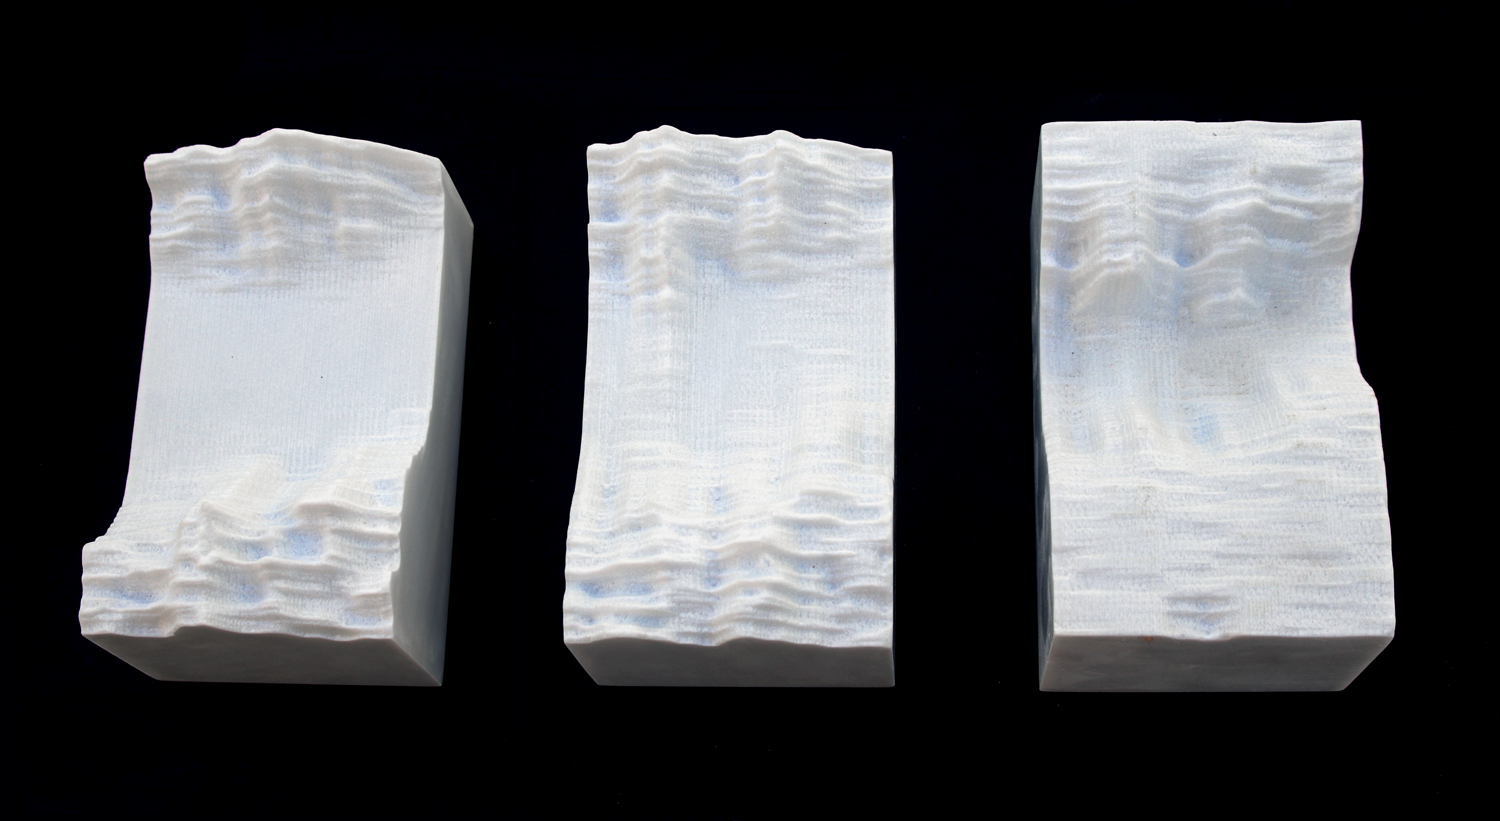
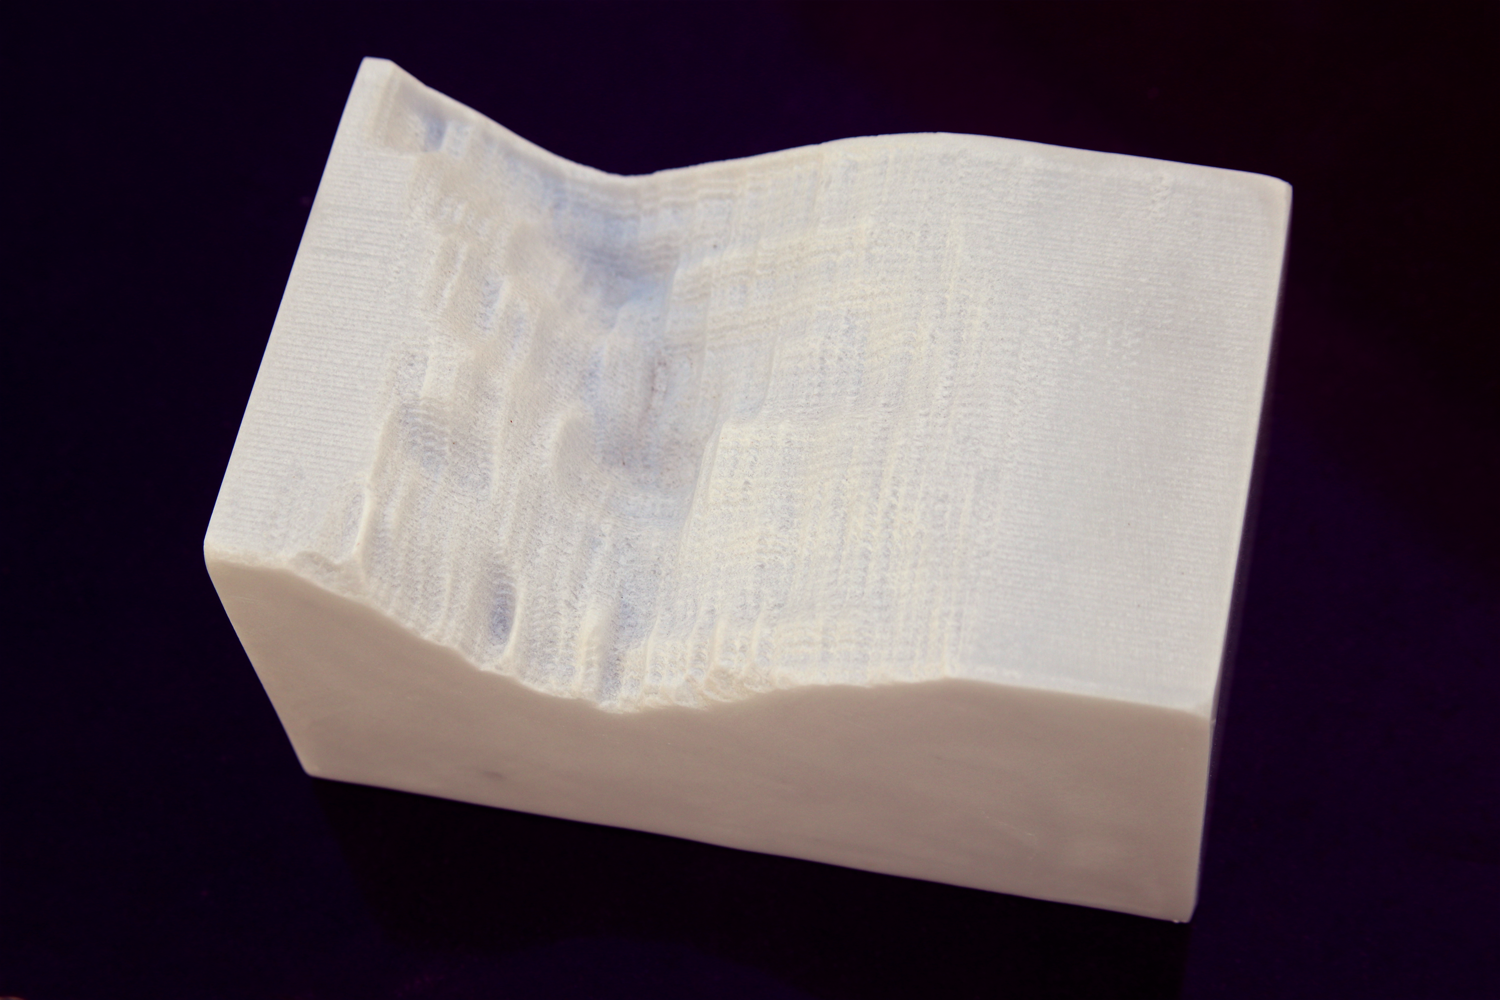
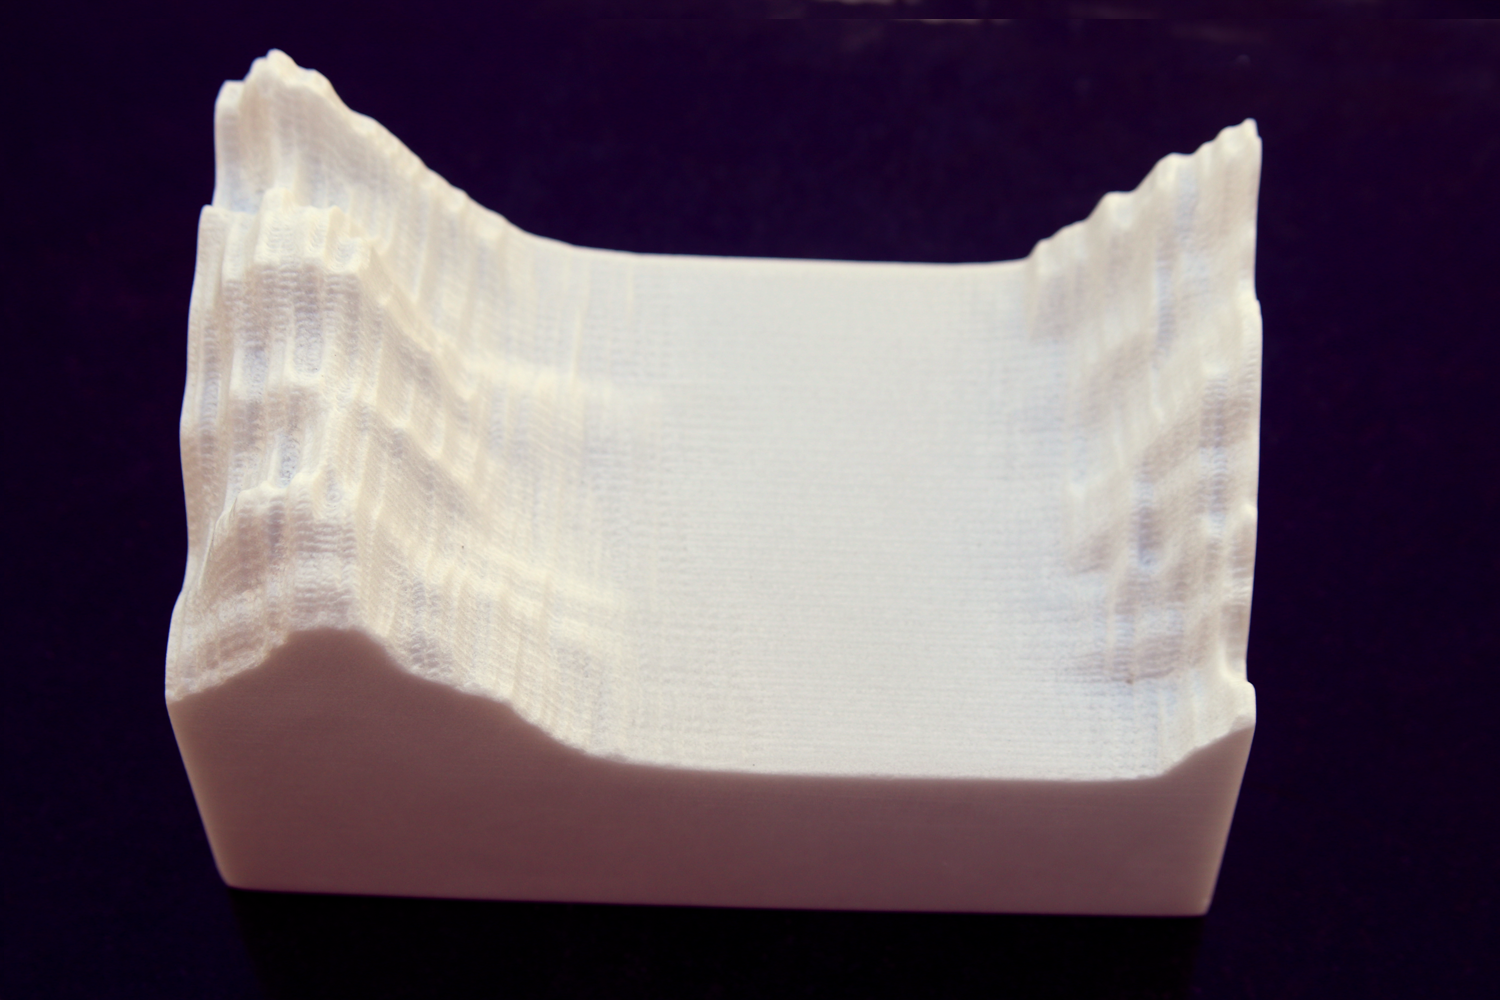
Marble sculptures created from ice data from bodies of water in the Polar Seas
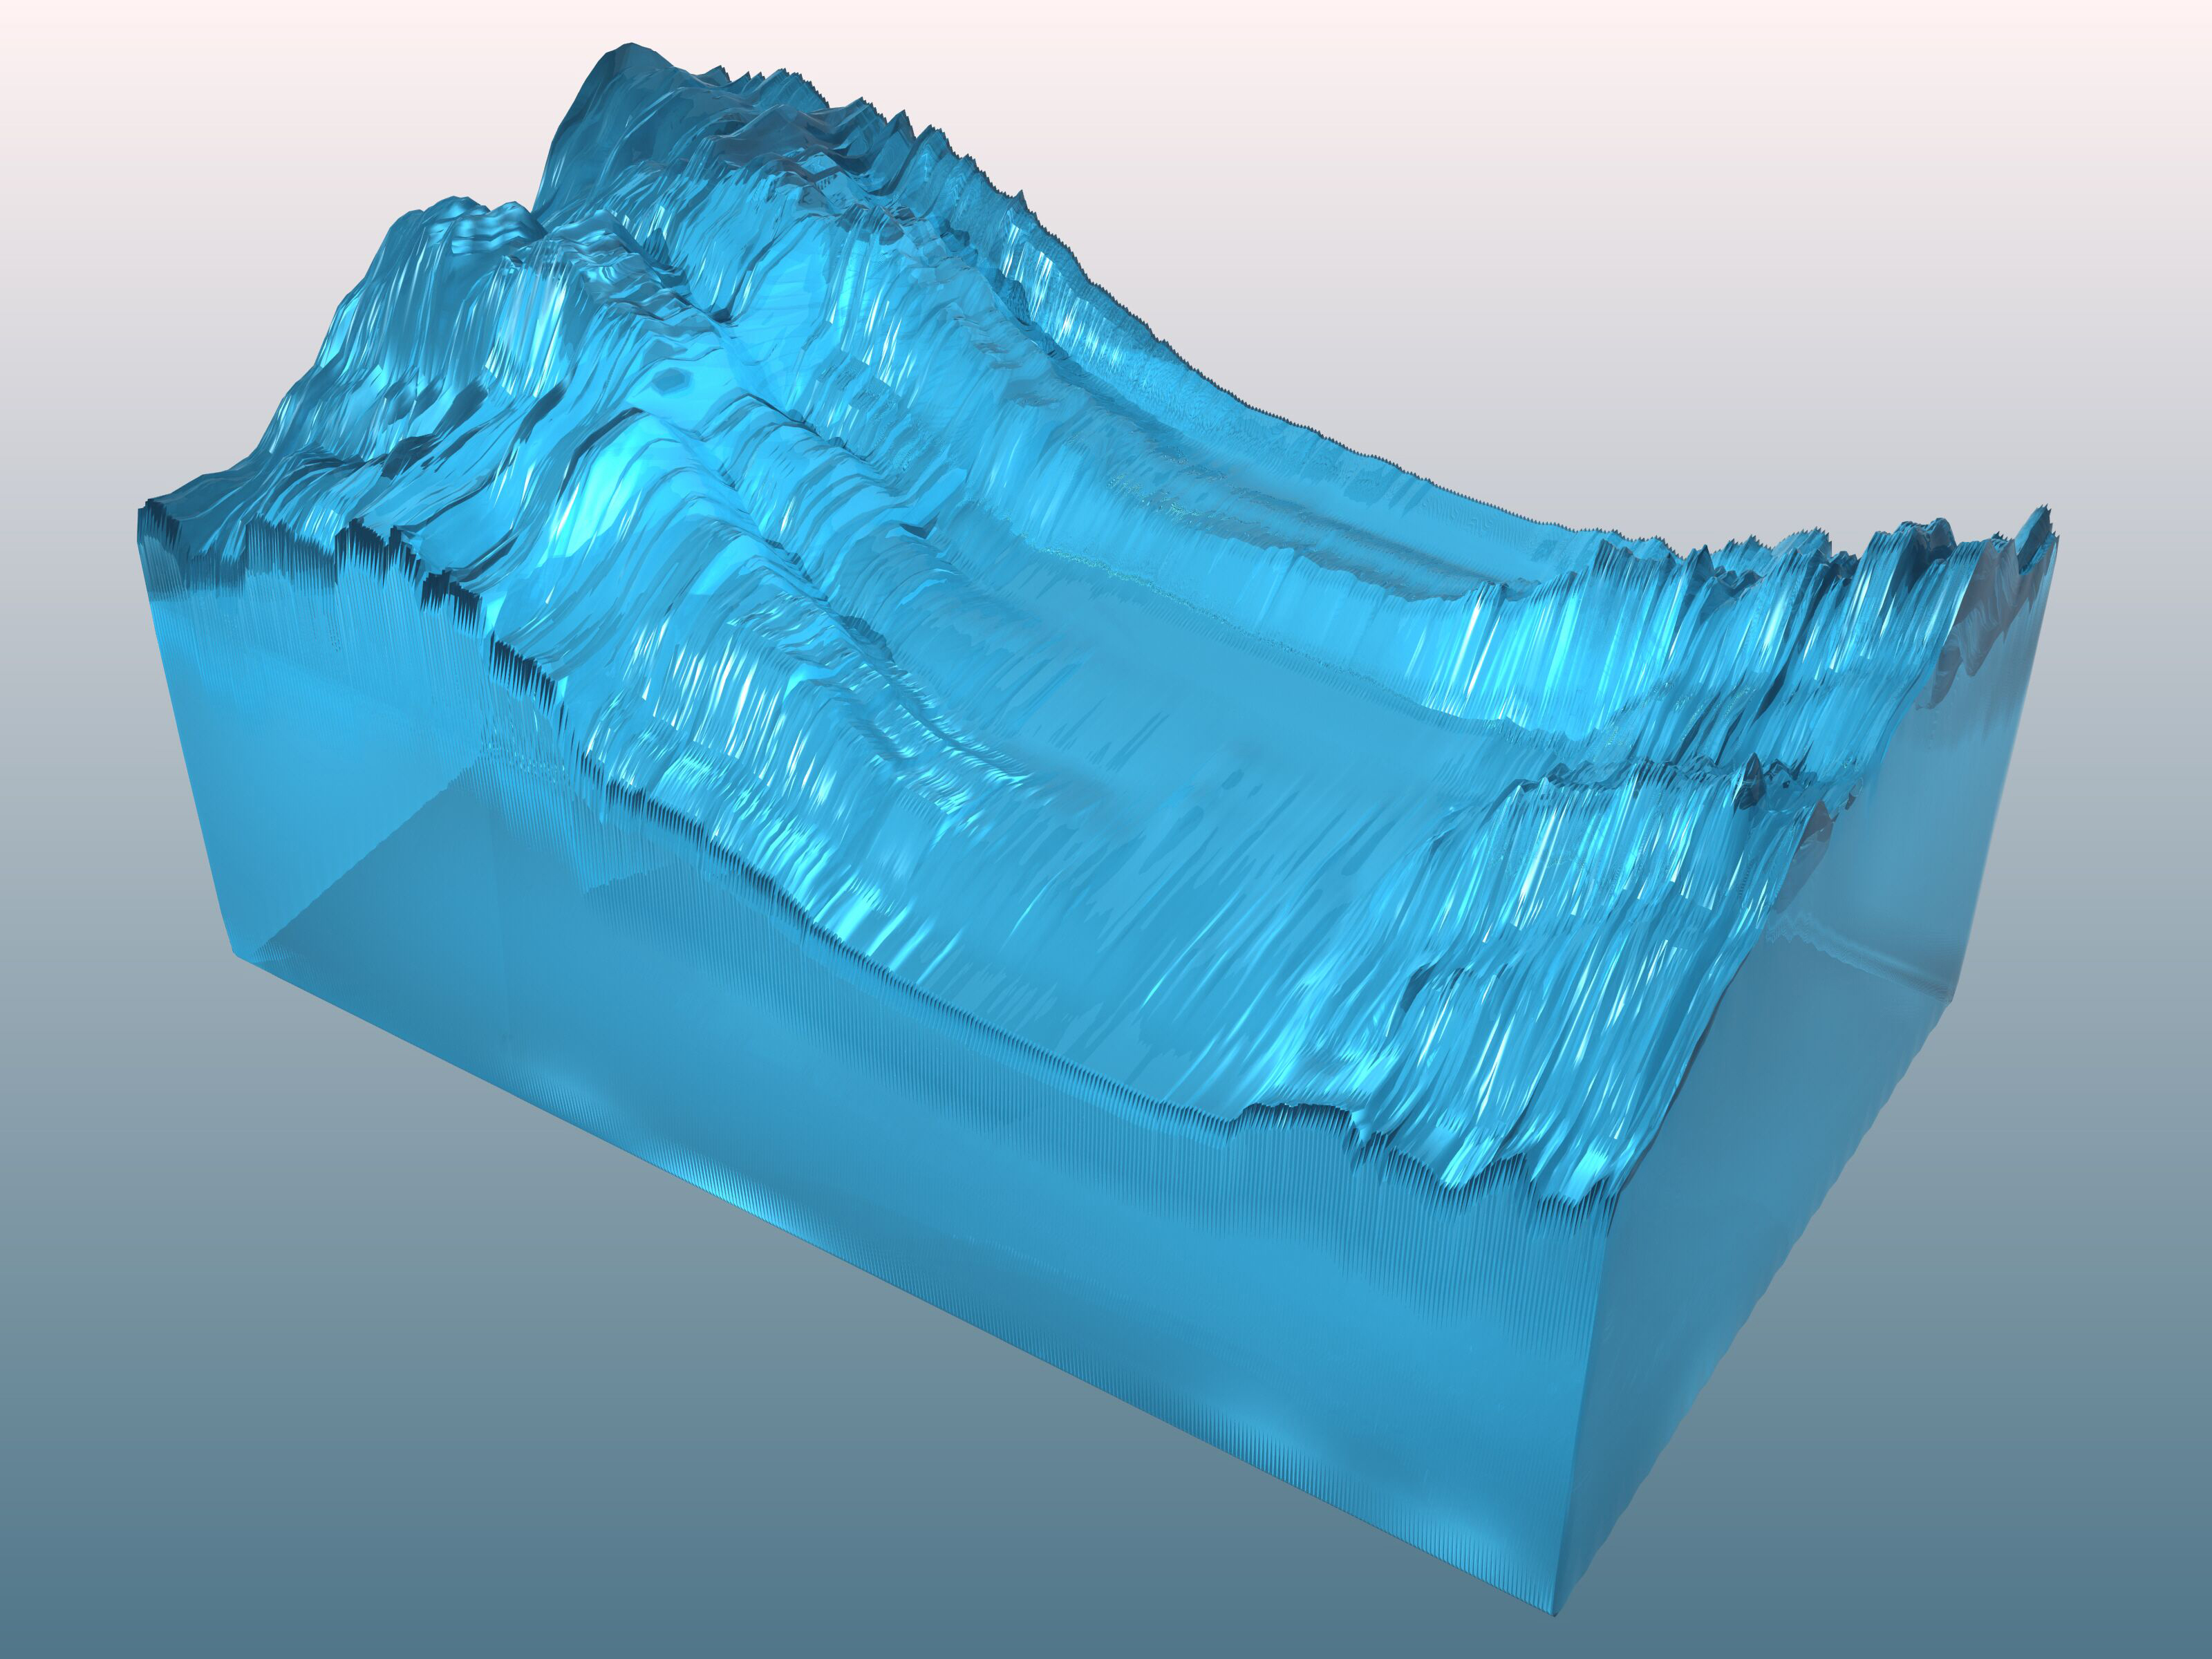
Digital Renderings
Design of the 3D models
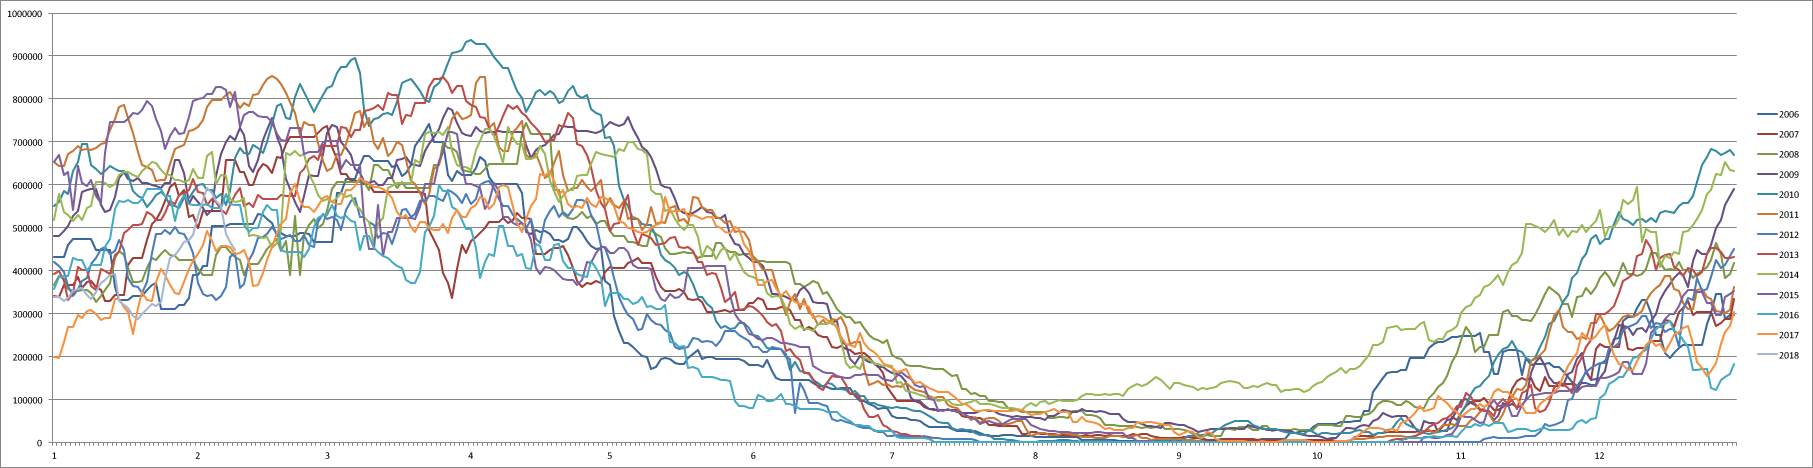
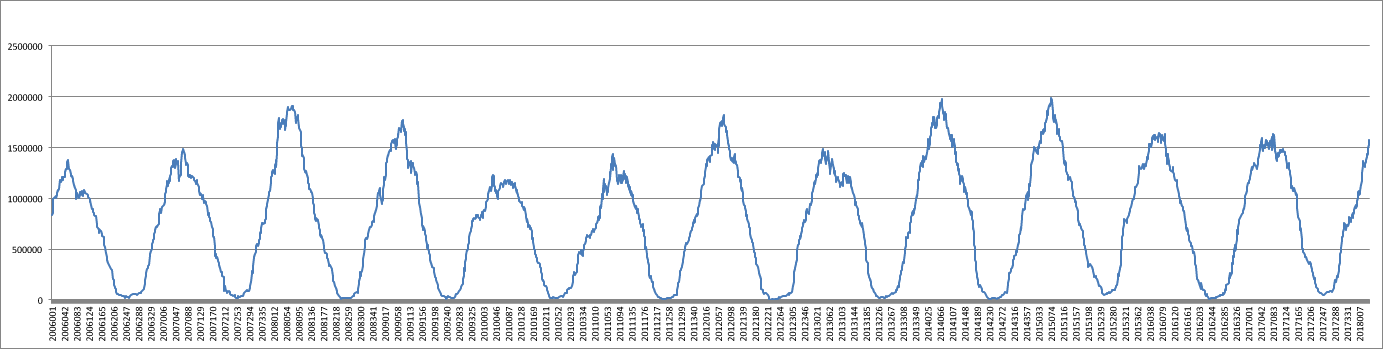
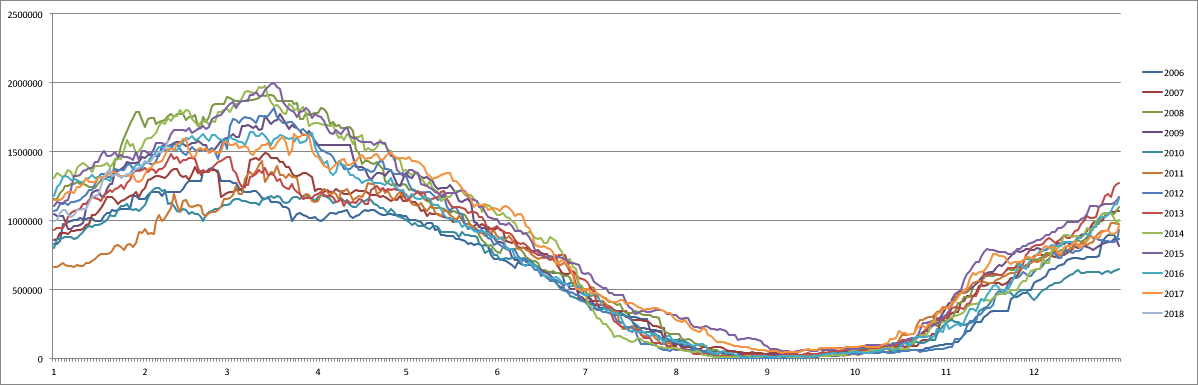
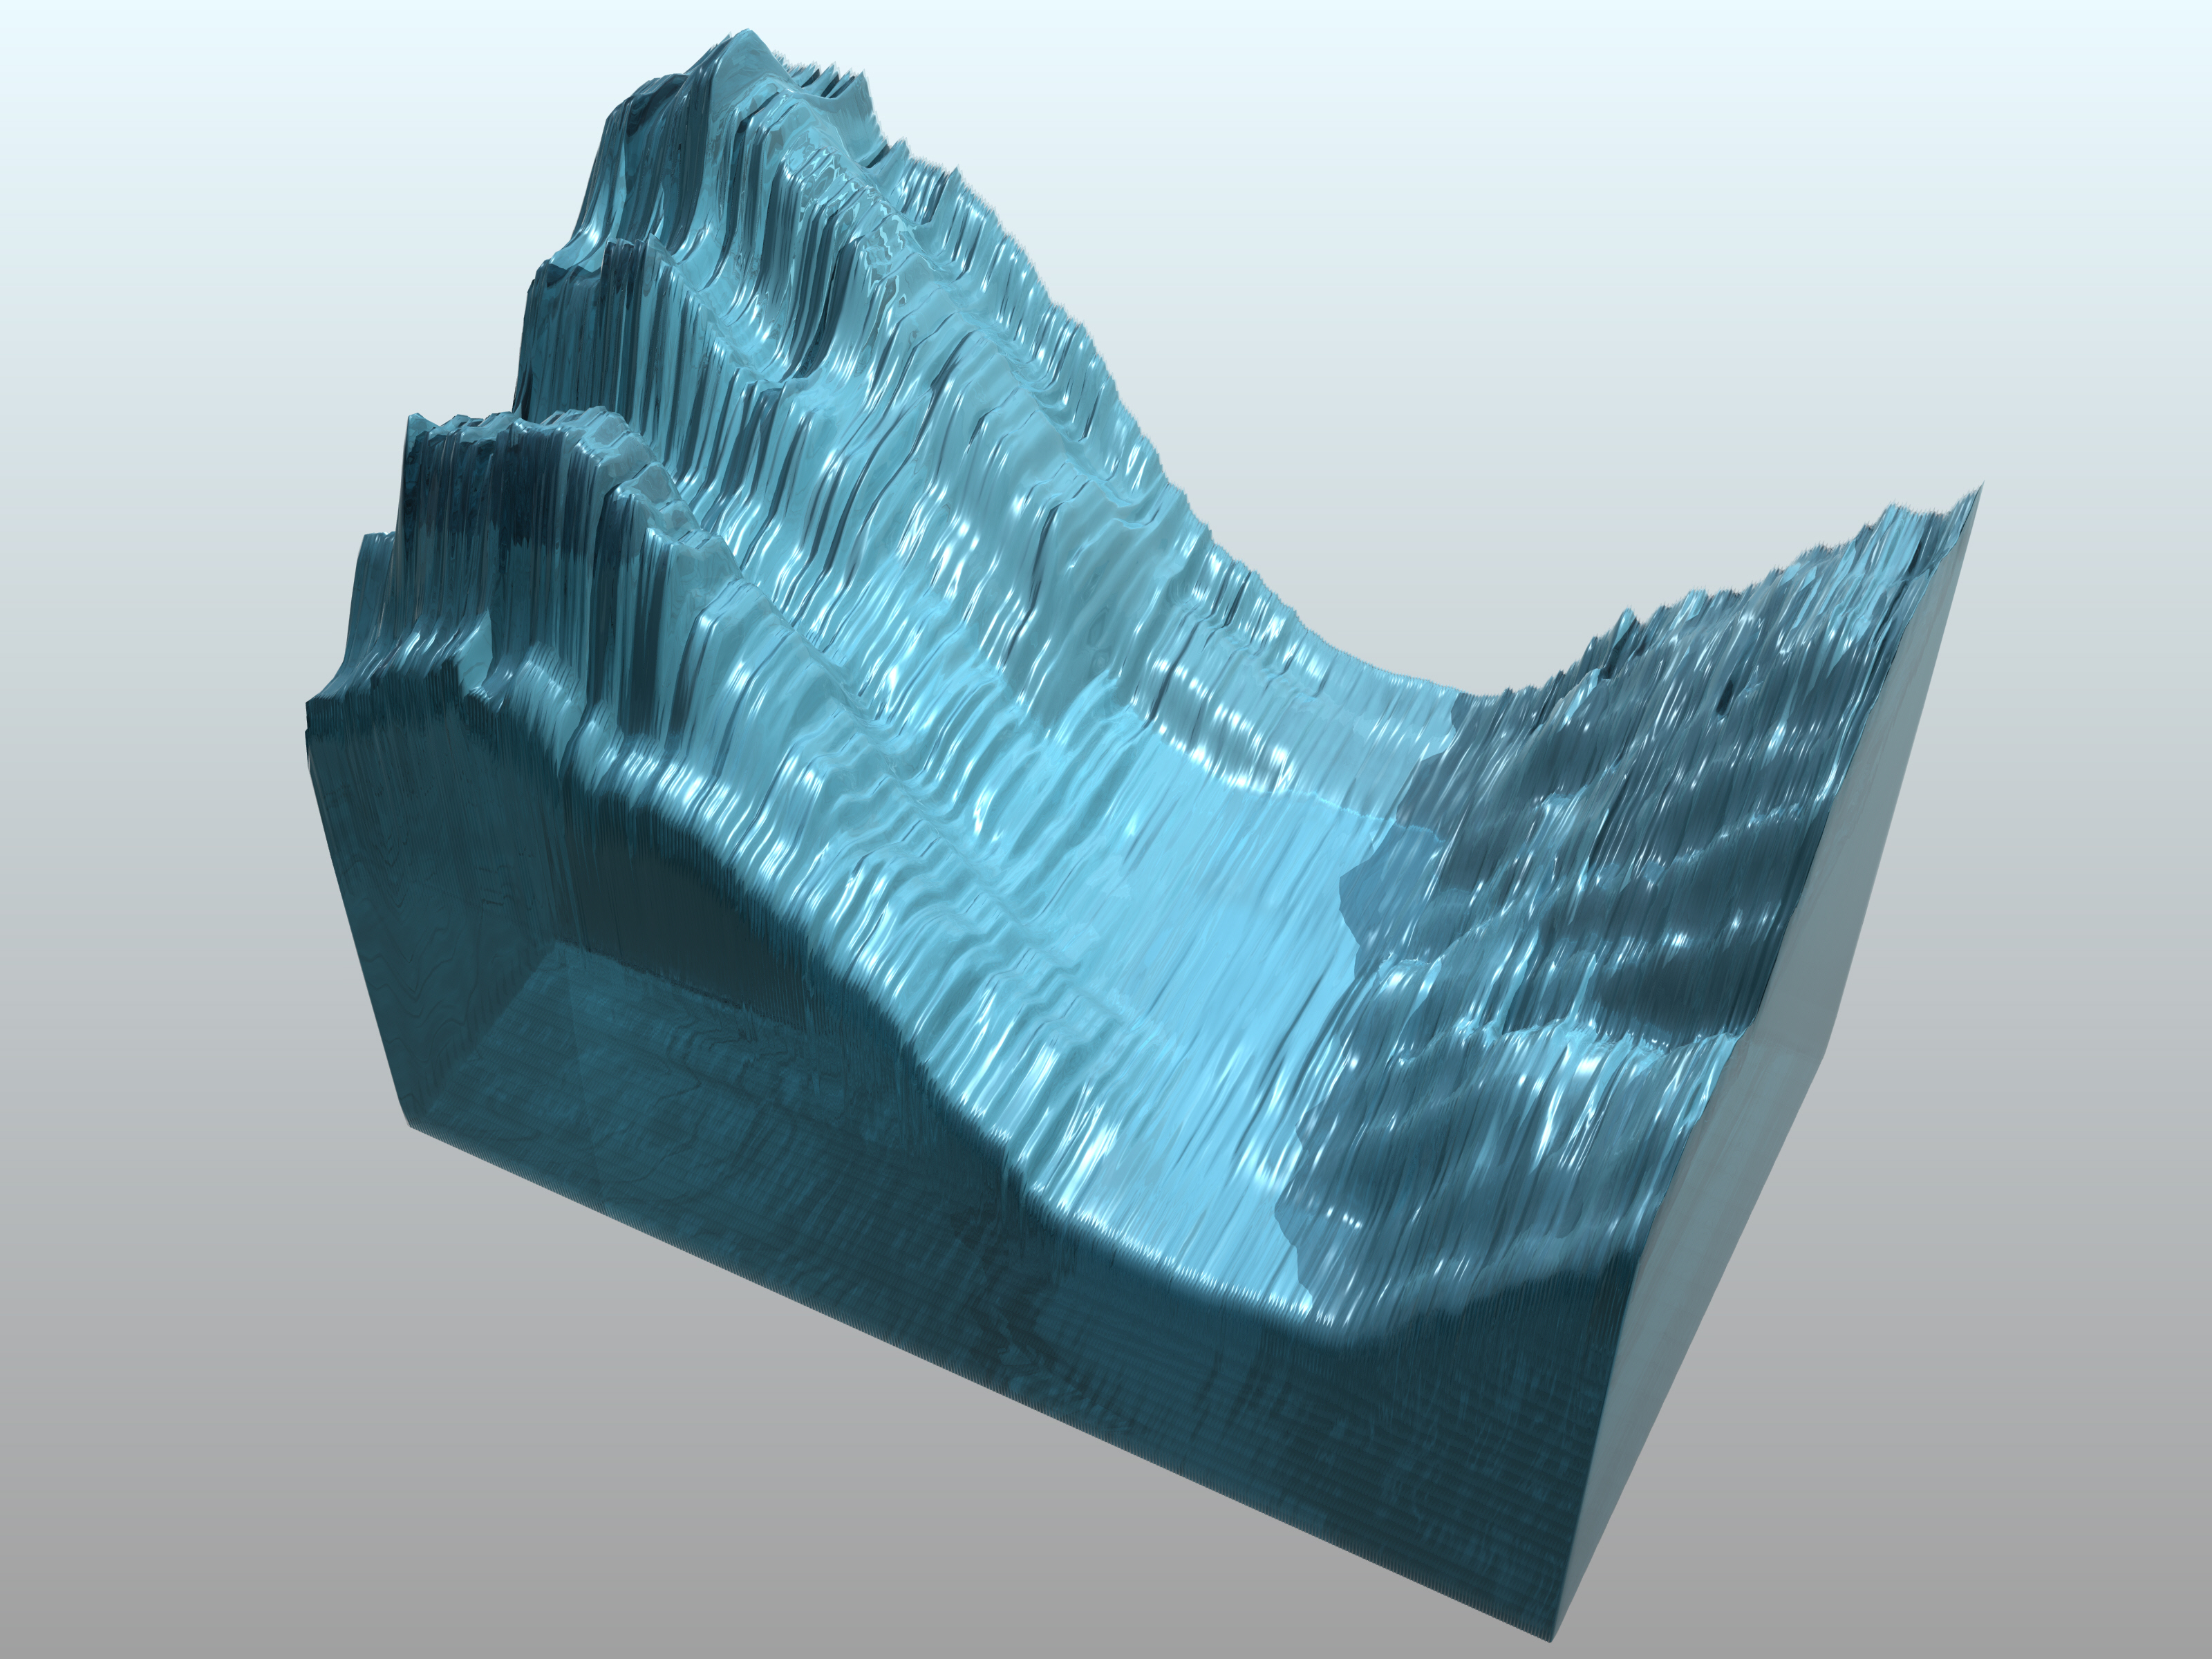
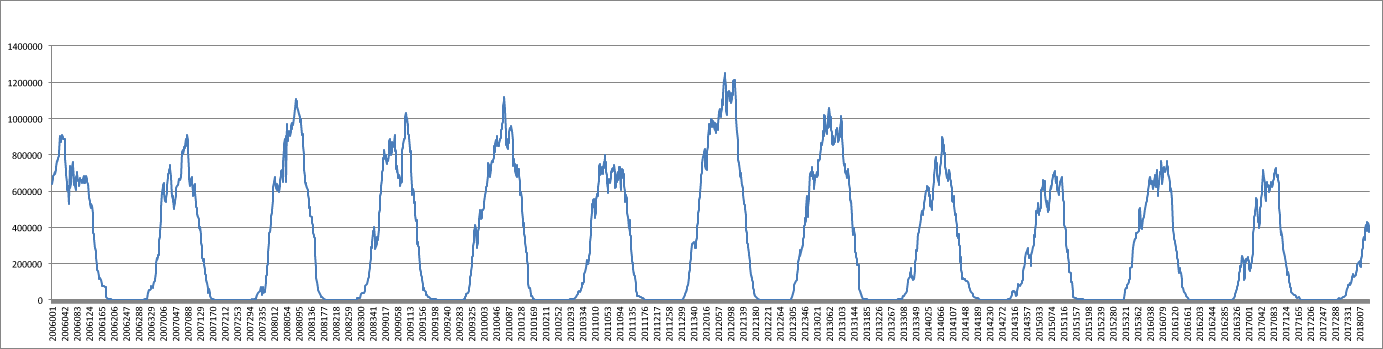
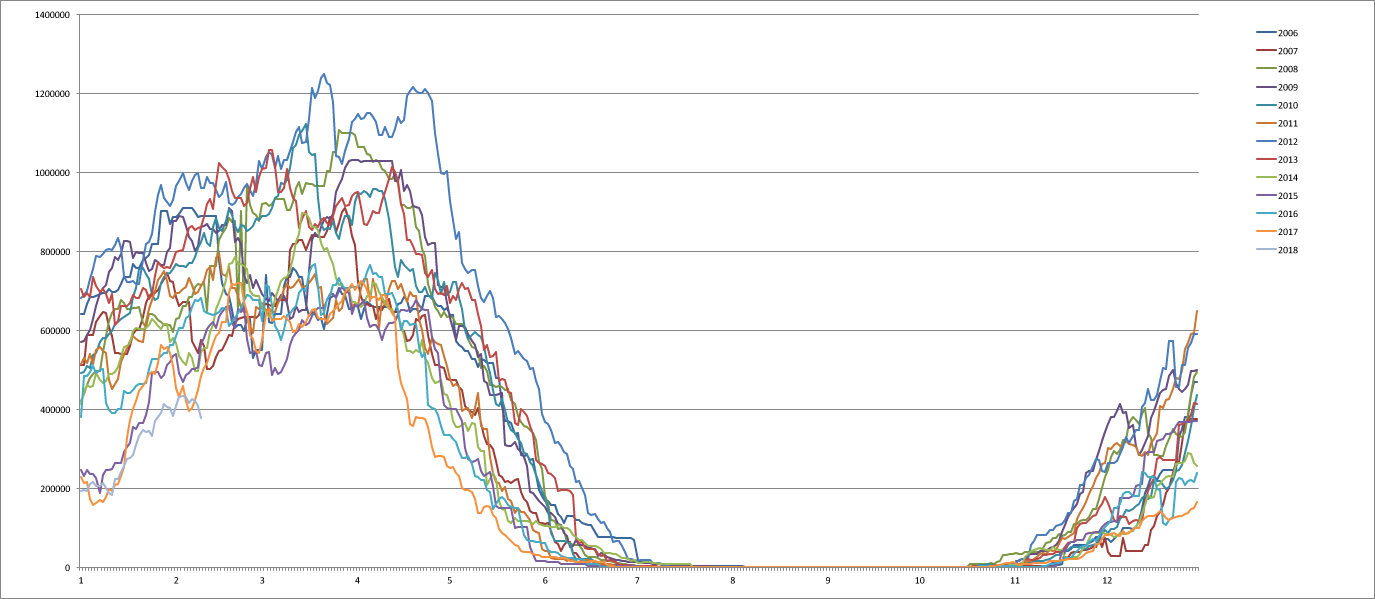
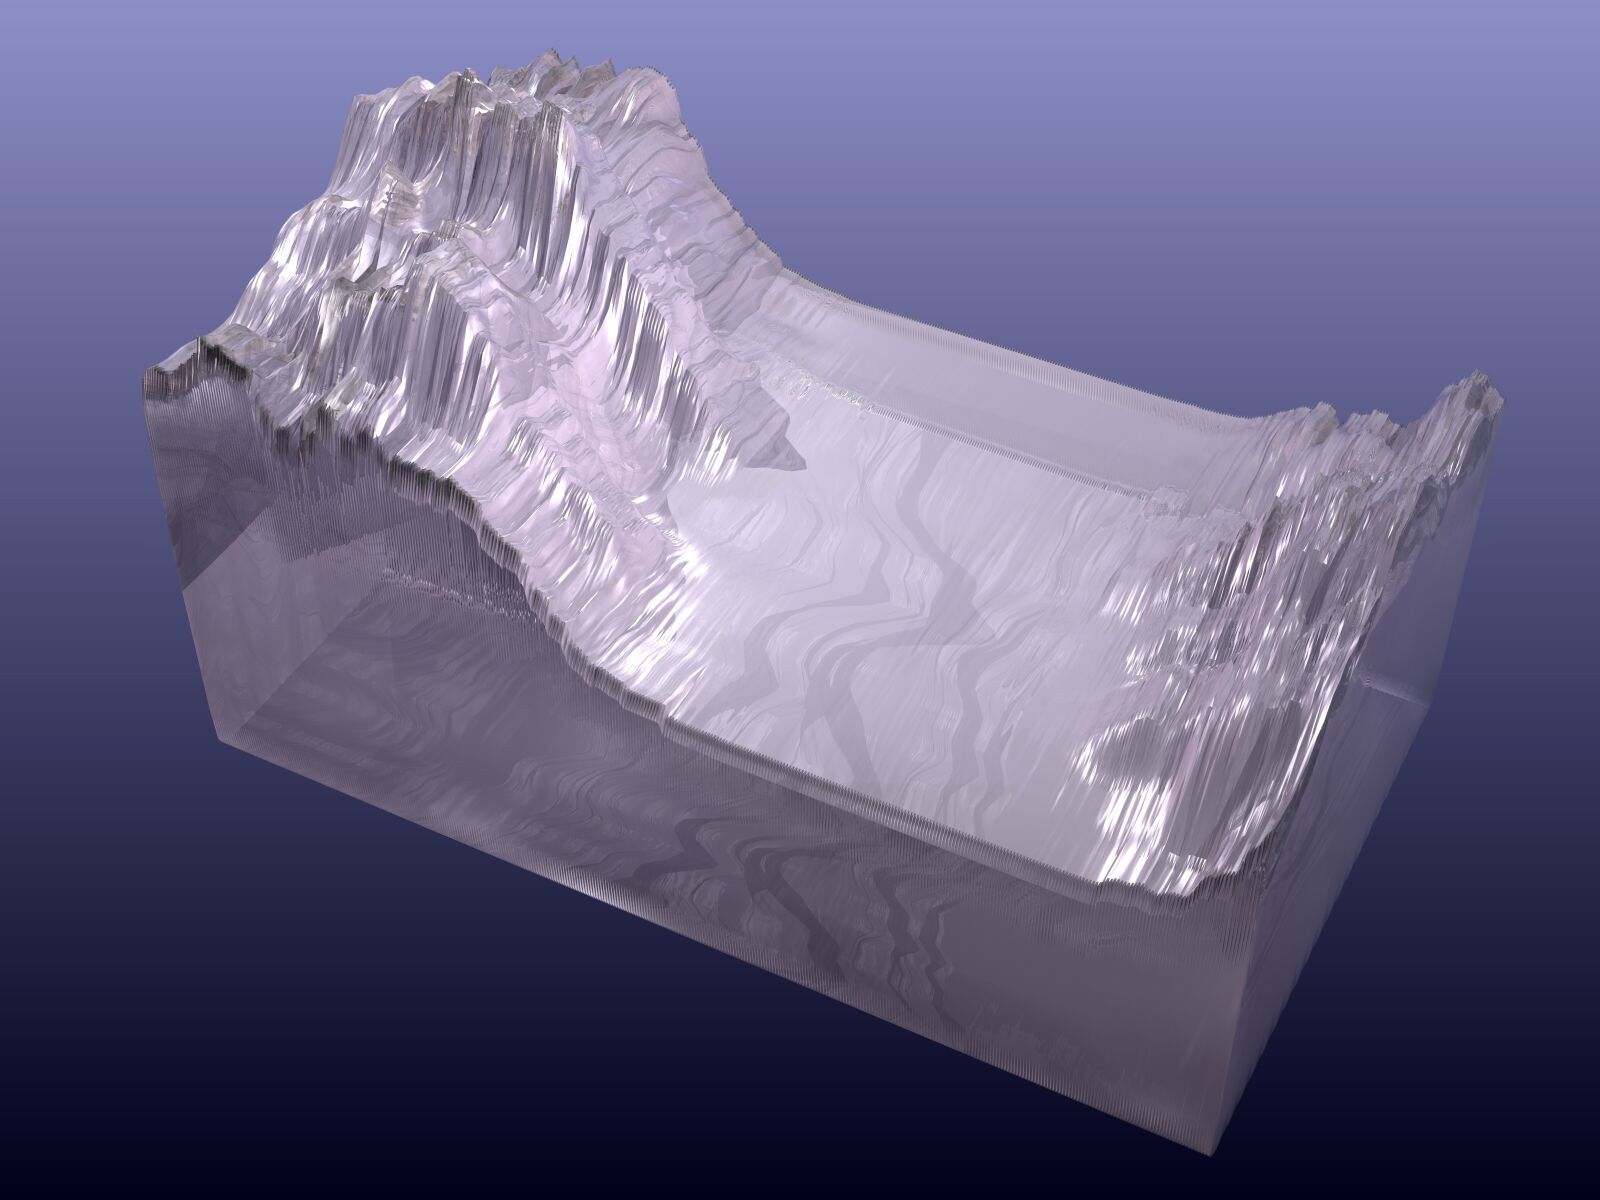
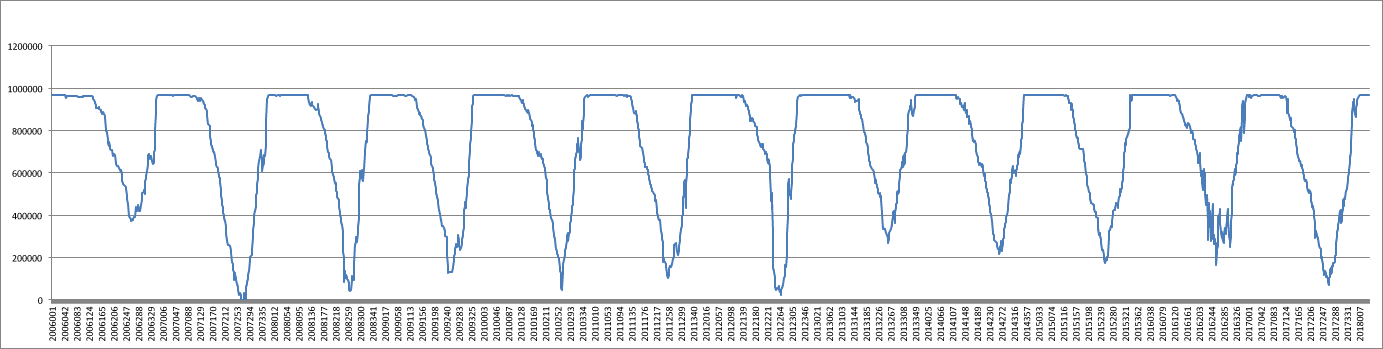
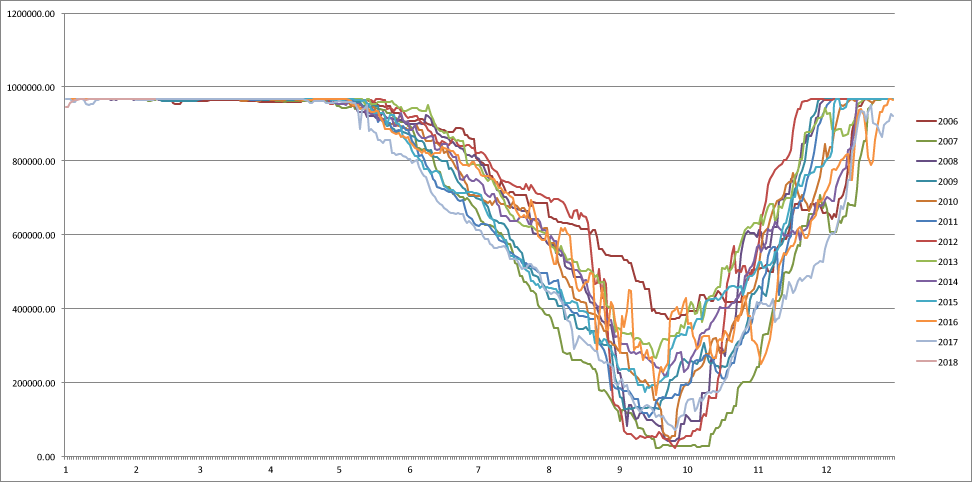
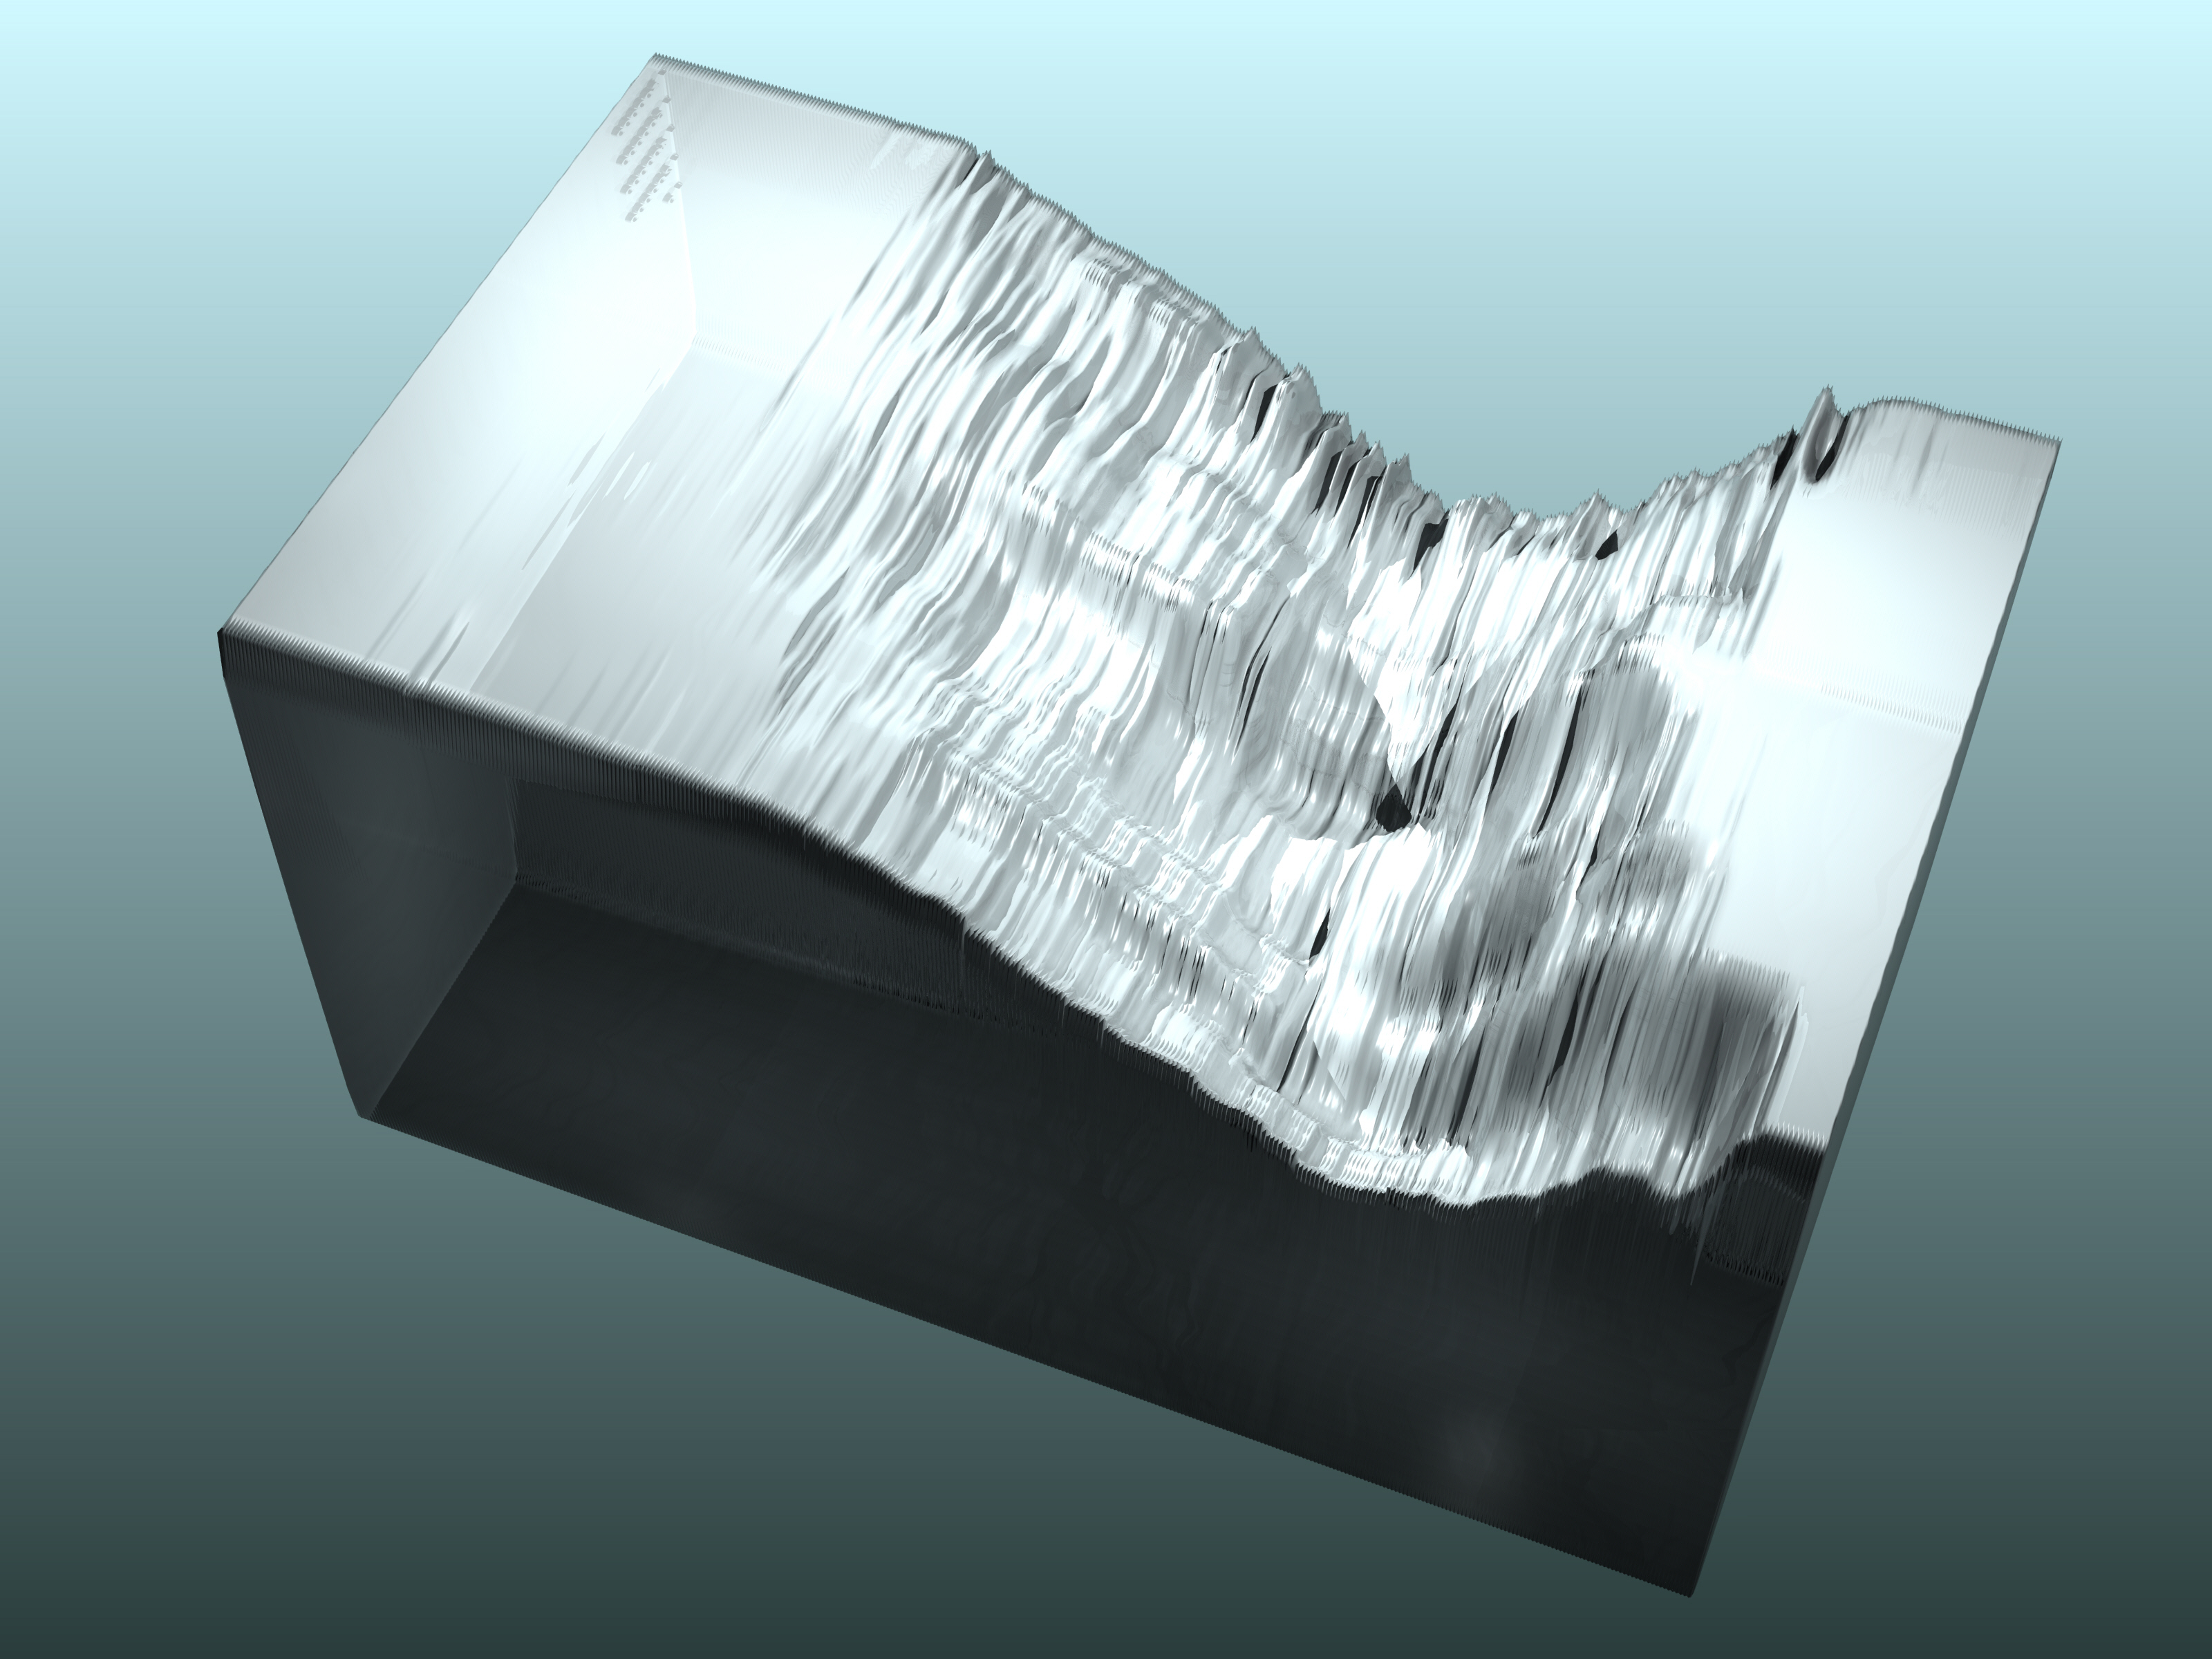
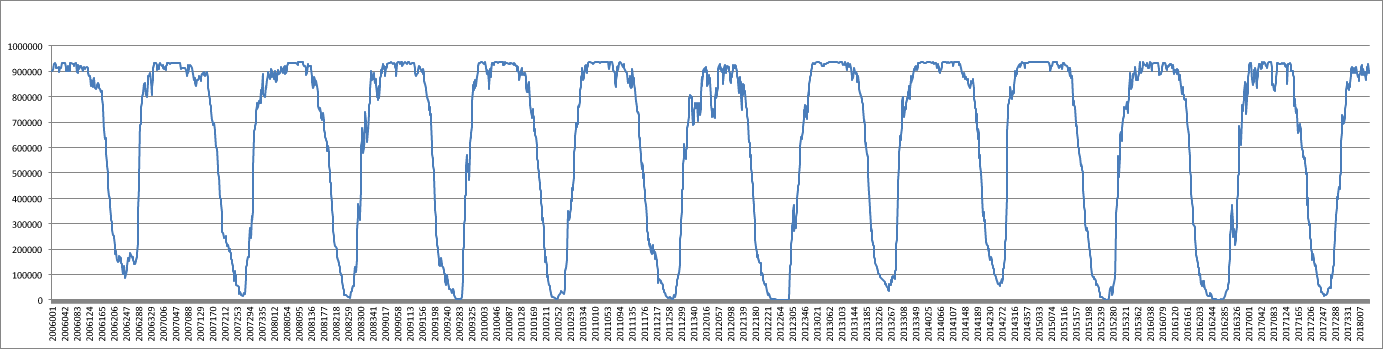
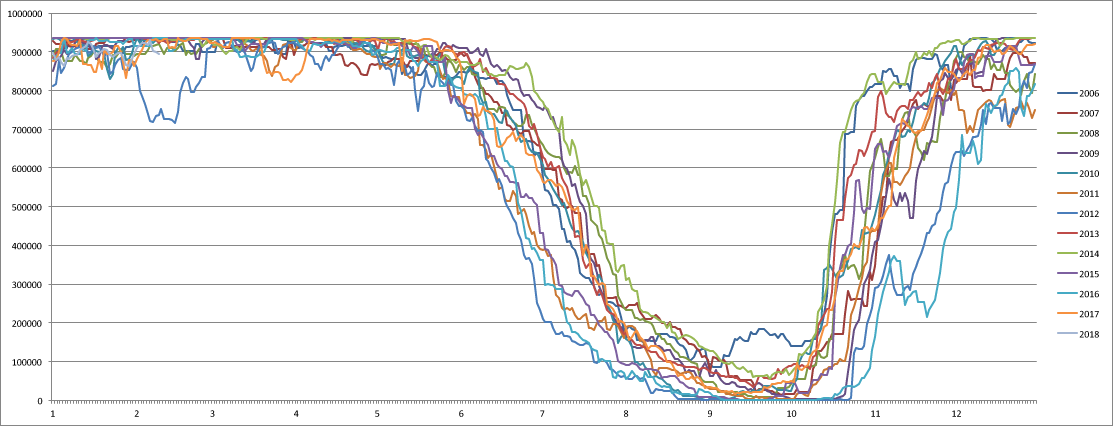
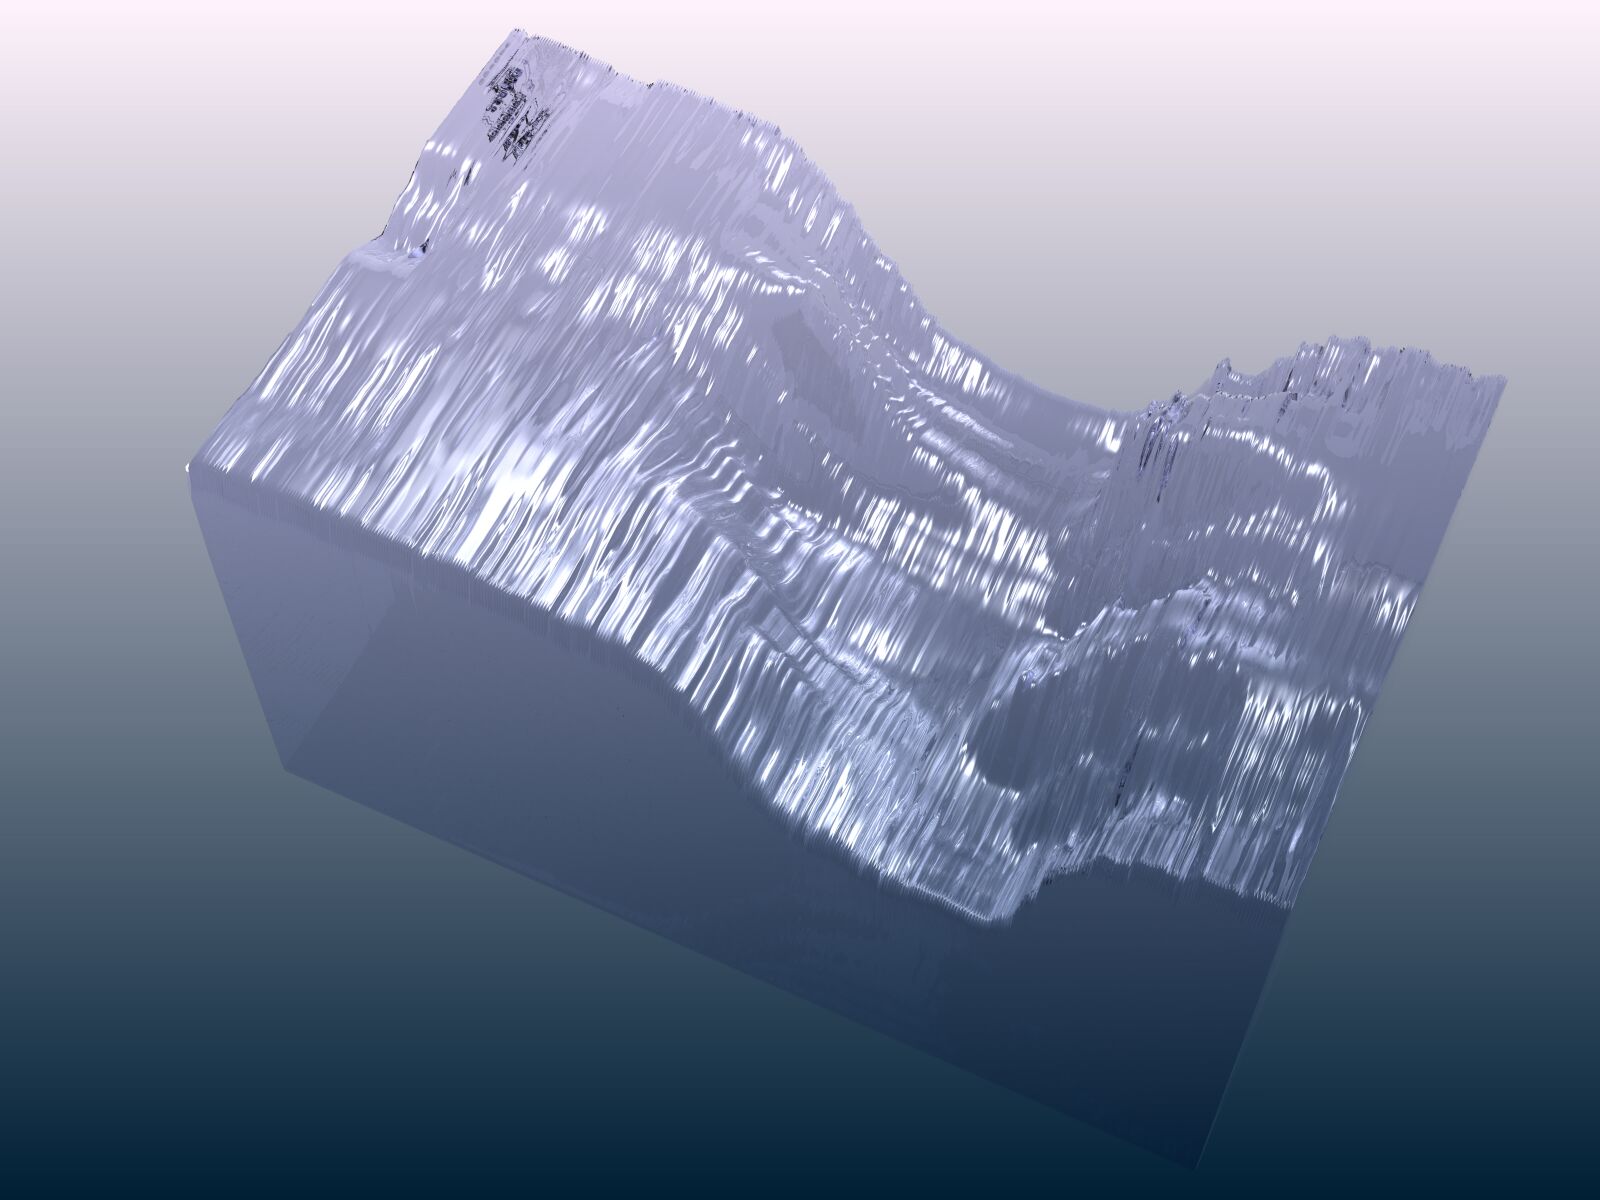
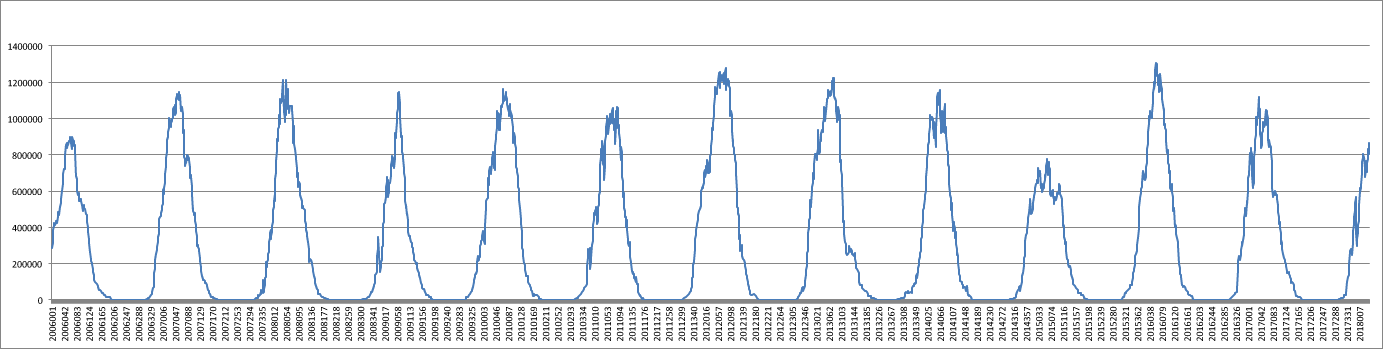
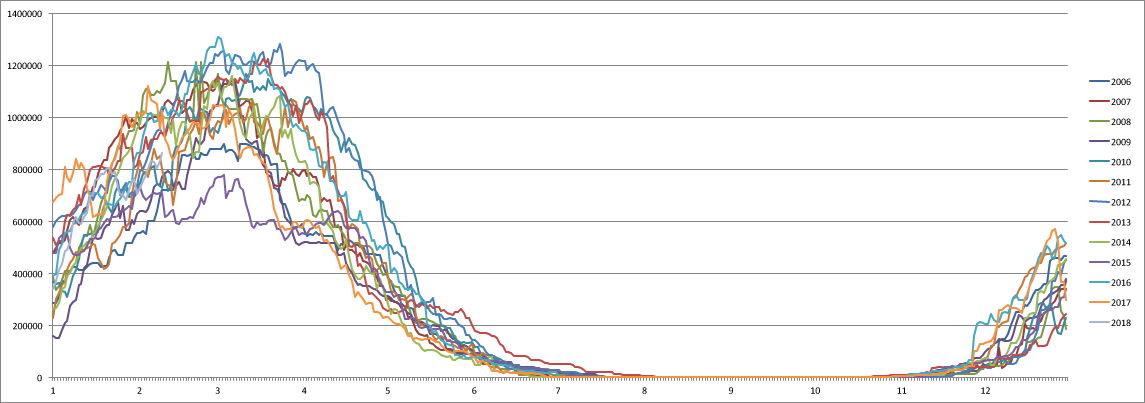
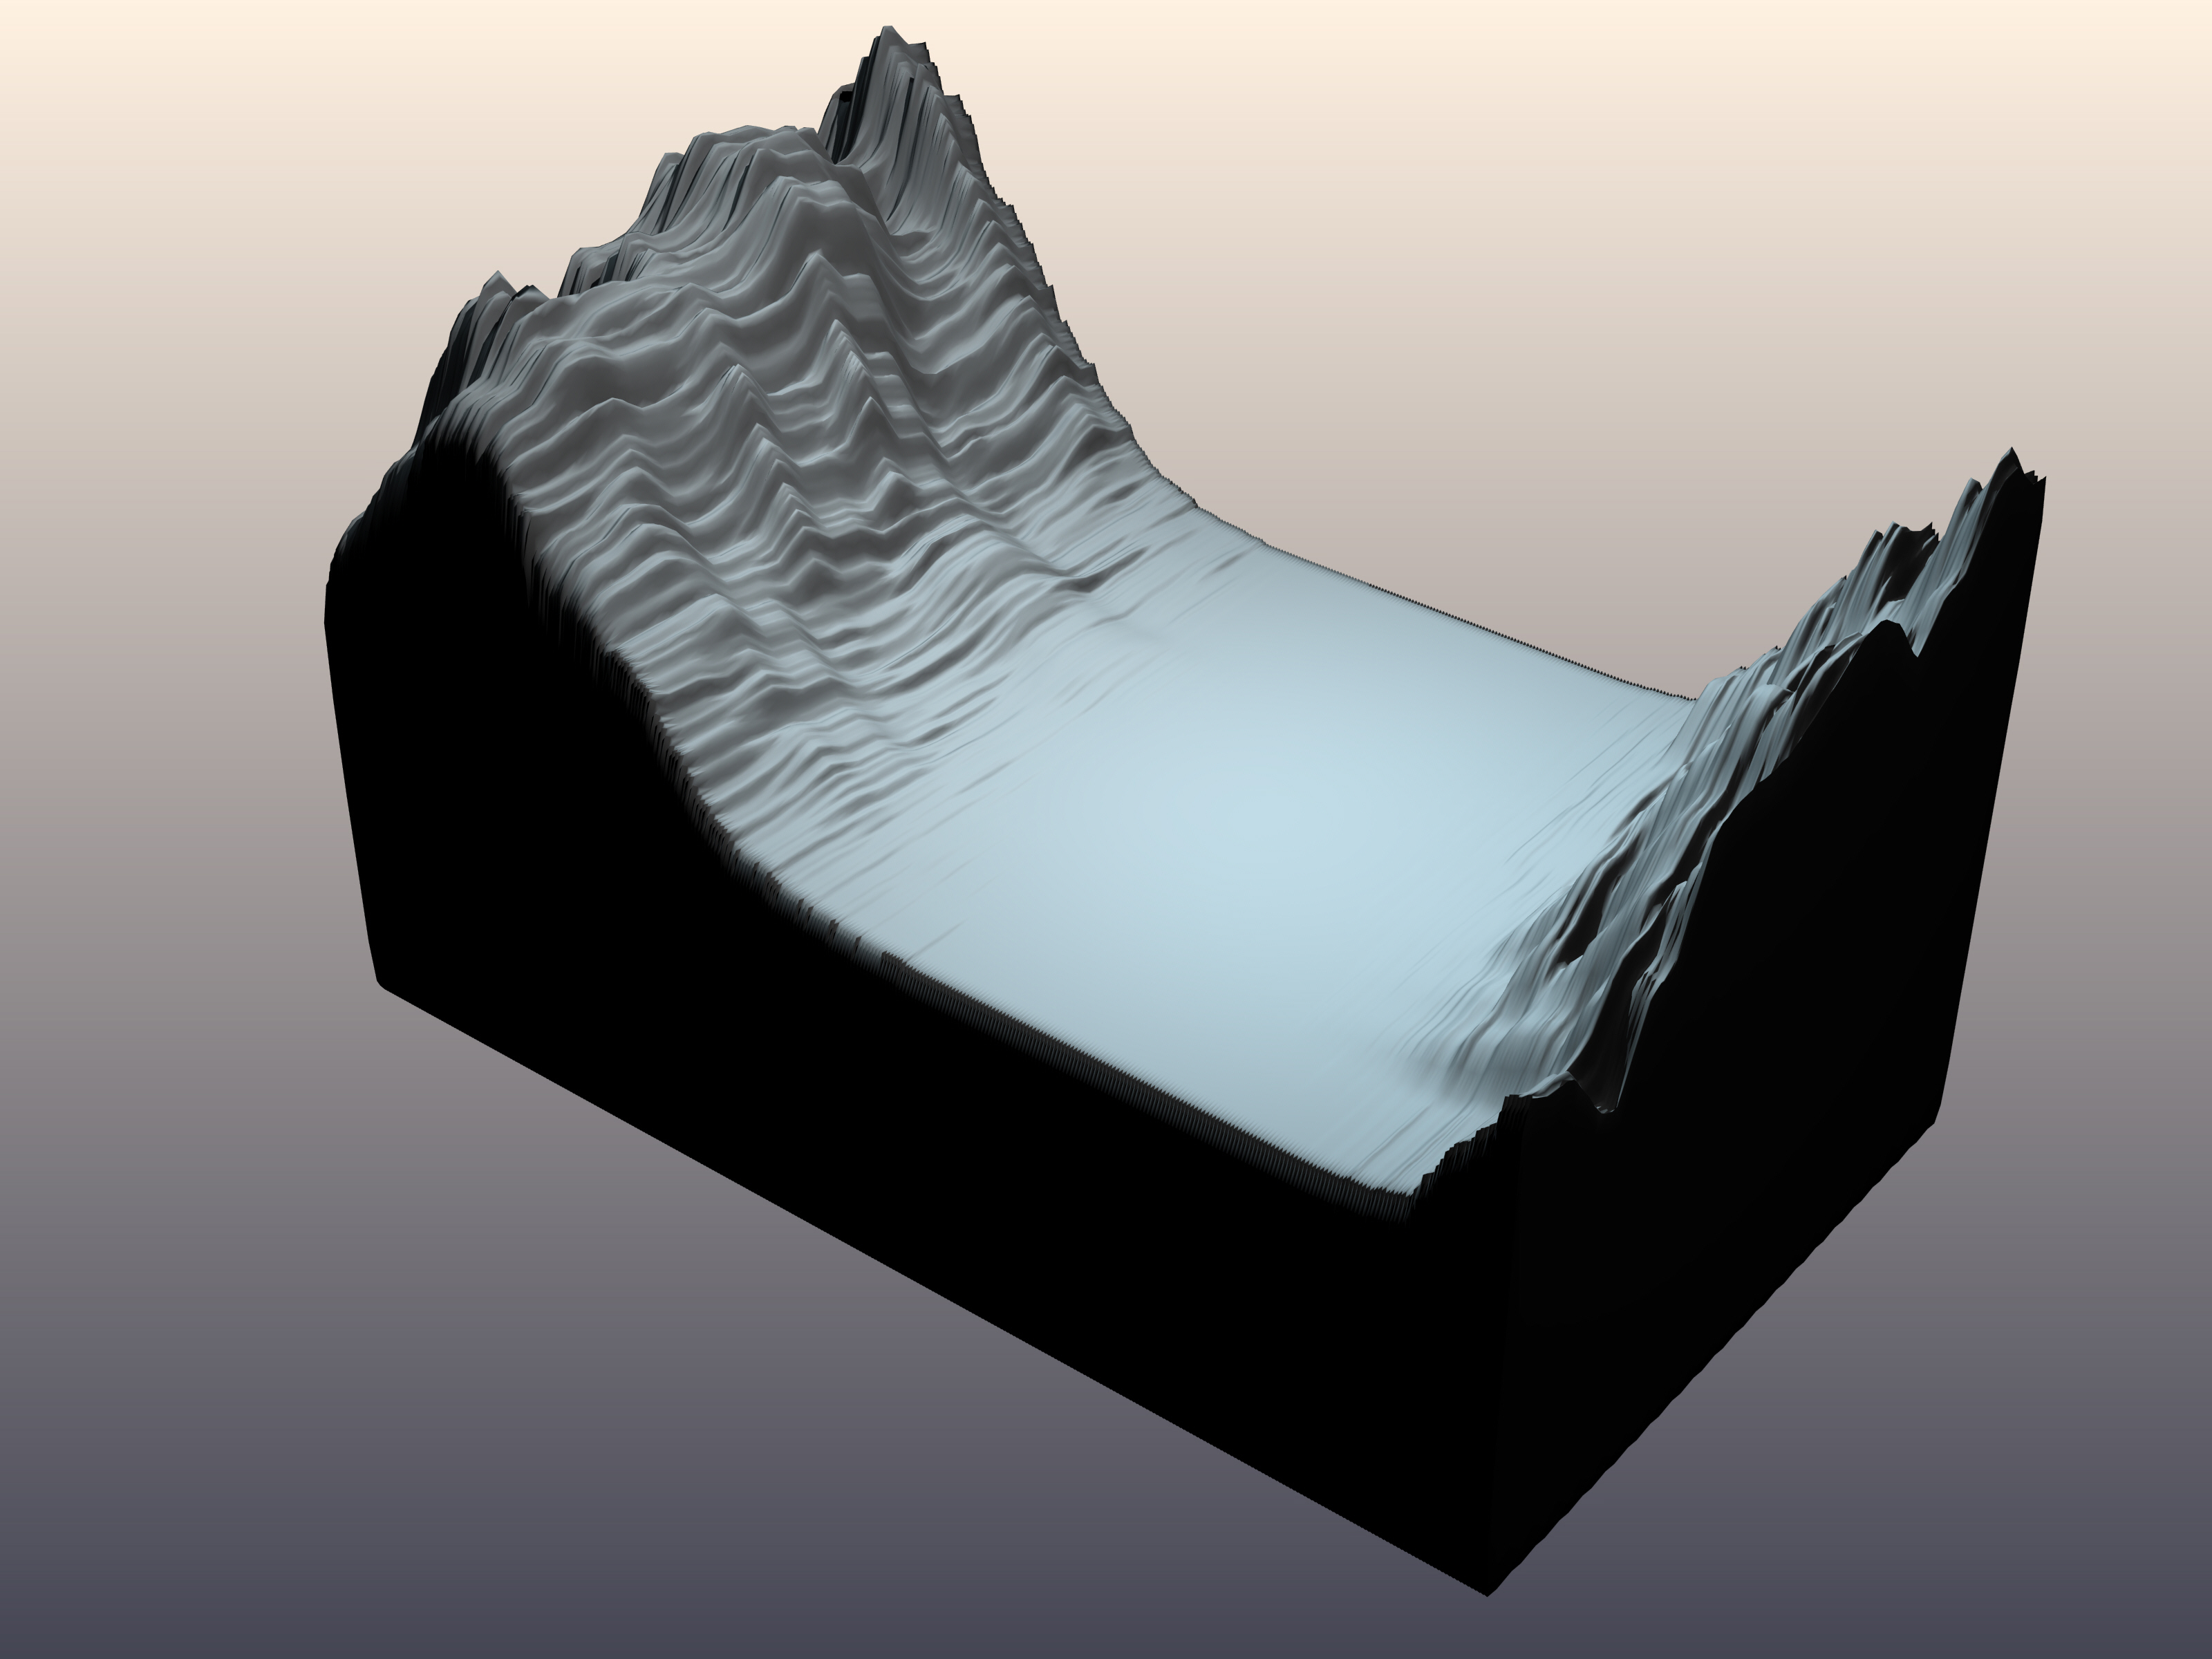
Below, we include examples of linear graphs of sea extent data and renderings of the generated models created from that data. In the generated models, each year of sea ice data is placed parallel to the next. This allows the changes in sea ice levels from year to year to be clearly seen.
You can download some of our ice data as a spreadsheet by clicking here
Each example includes:
1) The linear graph of sea extent data over several years
2) Th data from each year overlaid on a single graph
3) The generated 3D models
1) The linear graph of sea extent data over several years
2) Th data from each year overlaid on a single graph
3) The generated 3D models
Baffin Bay
Bering Sea
Chukchi Sea
Kara Sea
Sea of Otkhost
Barents Sea